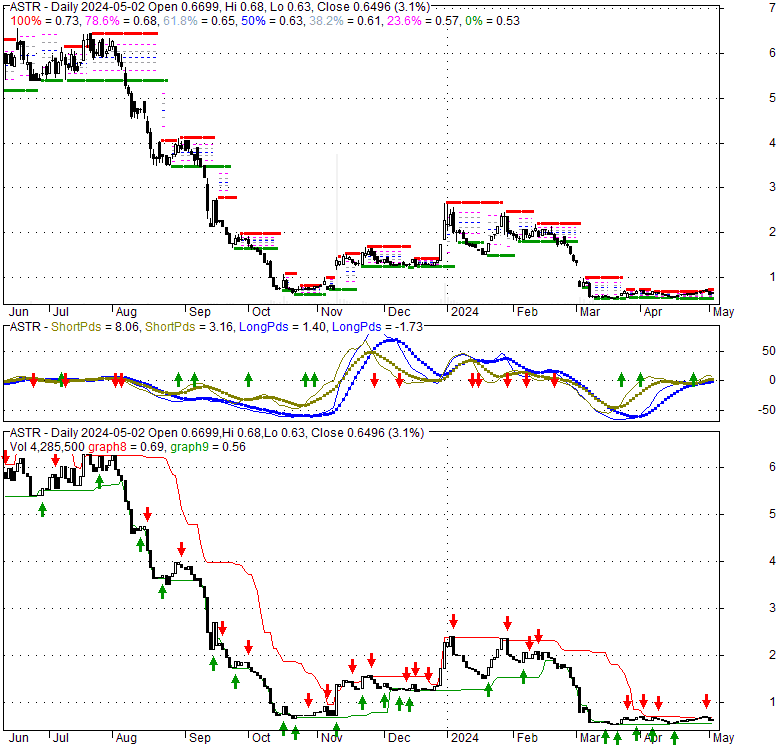
| 0.61 -0.02 (-3.17%) | 04-19 16:00 | |||||||||||||
|
|
| Short term | |
|||
| Mid term | ||||
| Targets | 6-month : | 0.76 | 1-year : | 0.86 |
| Resists | First : | 0.65 | Second : | 0.74 |
| Pivot price | 0.62 |
|||
| Supports | First : | 0.52 | Second : | 0.43 |
| MAs | MA(5) : | 0.59 |
MA(20) : | 0.63 |
| MA(100) : | 1.33 |
MA(250) : | 2.89 |
|
| MACD | MACD : | -0.1 |
Signal : | -0.2 |
| %K %D | K(14,3) : | 44.2 |
D(3) : | 34.9 |
| RSI | RSI(14): 38.7 |
|||
| 52-week | High : | 6.75 | Low : | 0.52 |
Price has closed above its short-term moving average. Short-term moving average is currently below mid-term; and below long-term moving average. From the relationship between price and moving averages: This stock is NEUTRAL in short-term; and BEARISH in mid-long term.[ ASTR ] has closed above bottom band by 40.8%. Bollinger Bands are 79.9% narrower than normal. The narrow width of the bands suggests low volatility as compared to its normal range. The bands have been in this narrow range for 19 bars. This is a sign that the market may be about to initiate a new trend.
| If tomorrow: | Open lower | Open higher |
| High: | 0.64 - 0.64 | 0.64 - 0.65 |
| Low: | 0.59 - 0.6 | 0.6 - 0.6 |
| Close: | 0.6 - 0.61 | 0.61 - 0.61 |
Astra Space, Inc. designs, tests, manufactures, launches, and operates space products and services. The company also designs, tests, manufactures, and operates propulsion modules to enable satellites to orbit in space. Its customers primarily include satellite operators, satellite manufacturers, government agencies, and defense prime contractors. The company was incorporated in 2016 and is headquartered in Alameda, California.
Thu, 04 Apr 2024
ASTR, HOL Shareholder Alert: Bronstein, Gewirtz & Grossman, LLC, A Leading Class Action Firm, Reminds Astra ... - AccessWire
Thu, 14 Mar 2024
ASTRA SPACE INVESTOR ALERT by the Former Attorney General of Louisiana: Kahn Swick & Foti, LLC Investigates ... - Business Wire
Fri, 08 Mar 2024
ASTR Stock Alert: Astra Space Is Going Private - InvestorPlace
Thu, 07 Mar 2024
Astra Space set for acquisition at $0.50 per share - Investing.com
Thu, 07 Mar 2024
Space company Astra going private to avoid bankruptcy after dismal public run - CNBC
Thu, 07 Mar 2024
Astra Space plunges on take-private deal at $0.50/share (NASDAQ:ASTR) - Seeking Alpha
| Price to Book Value: P/BV, a ratio used to compare book value to its current market price, to gauge whether a stock is valued properly. |
Outperform |
| Price to Earnings: PE, the ratio for valuing a company that measures its current share price relative to its earnings per share (EPS). |
Underperform |
| Discounted cash flow: DCF, a valuation method used to estimate the value of an investment based on its expected future cash flows. |
Underperform |
| Return on Assets: ROA, indicates how profitable a company is in relation to its total assets, how efficiently uses assets to generate a profit. |
Underperform |
| Return on Equity: ROE, a measure of financial performance calculated by dividing net income by equity. a gauge of profitability and efficiency. |
Underperform |
| Debt to Equity: evaluate financial leverage, reflects the ability of equity to cover outstanding debts in the event of a business downturn. |
Outperform |

|
Exchange:
NASDAQ
|
|
|
Sector:
Industrials
|
|
|
Industry:
Aerospace & Defense
|
|
| Shares Out | 0 (M) |
| Shares Float | 19 (M) |
| Held by Insiders | 1.661e+007 (%) |
| Held by Institutions | 2.7 (%) |
| Shares Short | 1,500 (K) |
| Shares Short P.Month | 0 (K) |
| EPS | -1.6695e+008 |
| EPS Est Next Qtrly | 0 |
| EPS Est This Year | 0 |
| EPS Est Next Year | 0 |
| Book Value (p.s.) | 0 |
| Profit Margin | 0 % |
| Operating Margin | -12 % |
| Return on Assets (ttm) | 936.3 % |
| Return on Equity (ttm) | -68.2 % |
| Qtrly Rev. Growth | 963000 % |
| Gross Profit (p.s.) | -30.47 |
| Sales Per Share | -73.06 |
| EBITDA (p.s.) | 0 |
| Qtrly Earnings Growth | -7.4 % |
| Operating Cash Flow | 0 (M) |
| Levered Free Cash Flow | -128 (M) |
| PE Ratio | -0.01 |
| PEG Ratio | 0 |
| Price to Book value | 0 |
| Price to Sales | -0.01 |
| Price to Cash Flow | 4.13 |
| Dividend | 0 |
| Forward Dividend | 1.64e+006 |
| Dividend Yield | 0% |
| Dividend Pay Date | Invalid DateTime. |
| Ex-Dividend Date | Invalid DateTime. |