| 1.49 0.03 (2.05%) | 09-06 15:59 | |||||||||||||
|
|
| Short term | |
|||
| Mid term | ||||
| Targets | 6-month : | 1.76 | 1-year : | 2.05 |
| Resists | First : | 1.5 | Second : | 1.76 |
| Pivot price | 1.28 |
|||
| Supports | First : | 1.28 | Second : | 1.13 |
| MAs | MA(5) : | 1.27 |
MA(20) : | 1.29 |
| MA(100) : | 1.72 |
MA(250) : | 2.88 |
|
| MACD | MACD : | -0.1 |
Signal : | -0.1 |
| %K %D | K(14,3) : | 54.9 |
D(3) : | 38.7 |
| RSI | RSI(14): 54.3 |
|||
| 52-week | High : | 8.84 | Low : | 1.1 |
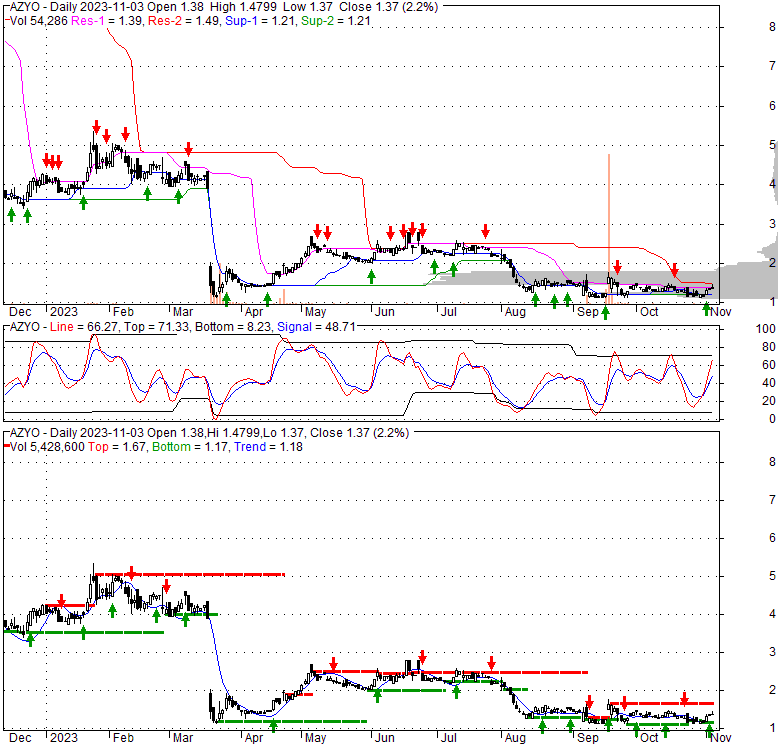
Price has closed above its short-term moving average. Short-term moving average is currently below mid-term; and below long-term moving average. From the relationship between price and moving averages: This stock is NEUTRAL in short-term; and BEARISH in mid-long term.[ AZYO ] has closed below upper band by 25.0%. Bollinger Bands are 33.9% narrower than normal. The current width of the bands does not suggest anything about the future direction or movement of prices.
| If tomorrow: | Open lower | Open higher |
| High: | 1.48 - 1.49 | 1.49 - 1.49 |
| Low: | 1.36 - 1.36 | 1.36 - 1.37 |
| Close: | 1.36 - 1.37 | 1.37 - 1.38 |
Aziyo Biologics, Inc., a regenerative medicine company, focuses on the development of regenerative medical products to address the implantable electronic device/cardiovascular, orthopedic/spinal repair, and soft tissue reconstruction markets. It offers CanGaroo that combines the envelope with antibiotics and is designed to reduce the risk of infection following surgical implantation of an electronic device. The company also provides cardiovascular products, such as ProxiCor for use as an intracardiac patch or pledget for tissue repairs; Tyke for use in neonates and infants to repair pericardial structures; and VasCure, a patch material to repair or reconstruct the peripheral vasculature, including the carotid, renal, iliac, femoral, and tibial blood vessels for cardiovascular, vascular, and general surgeons. In addition, it offers Fiber VBM, ViBone, and OsteGro V that are human tissue-derived bone allografts designed to protect and preserve native bone cells; and SimpliDerm, a pre-hydrated HADM designed to repair or replacement of damaged or inadequate integumental tissues. Further, the company provides contract manufacturing services for various products to corporate customers. It sells its products to hospitals and other healthcare facilities through its direct sales force, commercial partners, and independent sales agents. The company was incorporated in 2015 and is headquartered in Silver Spring, Maryland.
Mon, 14 Aug 2023
Aziyo Biologics Reports Second Quarter 2023 Financial Results - Transformation Continues to Drug-Eluting Biomatrix ... - Yahoo Finance
Fri, 14 Jul 2023
Aziyo Biologics Announces Voluntary Recall of Viable Bone Matrix Products - OrthoSpineNews
Thu, 23 Mar 2023
Silver Spring's Aziyo Biologics laying off 12% of workforce - Washington Business Journal - The Business Journals
Wed, 22 Mar 2023
Aziyo Biologics and Sientra Announce SimpliDerm® Partnership to Improve Women's Access to Biologics for Soft ... - GlobeNewswire
Mon, 20 Mar 2023
Aziyo Biologics Provides Update on FDA Submission for CanGaroo® RM Antibacterial Envelope - Yahoo Finance
| Price to Book Value: P/BV, a ratio used to compare book value to its current market price, to gauge whether a stock is valued properly. |
Underperform |
| Price to Earnings: PE, the ratio for valuing a company that measures its current share price relative to its earnings per share (EPS). |
Neutral |
| Discounted cash flow: DCF, a valuation method used to estimate the value of an investment based on its expected future cash flows. |
Neutral |
| Return on Assets: ROA, indicates how profitable a company is in relation to its total assets, how efficiently uses assets to generate a profit. |
Underperform |
| Return on Equity: ROE, a measure of financial performance calculated by dividing net income by equity. a gauge of profitability and efficiency. |
Outperform |
| Debt to Equity: evaluate financial leverage, reflects the ability of equity to cover outstanding debts in the event of a business downturn. |
Underperform |

|
Exchange:
NASDAQ
|
|
|
Sector:
Healthcare
|
|
|
Industry:
Medical - Devices
|
|
| Shares Out | 12 (M) |
| Shares Float | 4 (M) |
| Held by Insiders | 2.1 (%) |
| Held by Institutions | 70.4 (%) |
| Shares Short | 68 (K) |
| Shares Short P.Month | 100 (K) |
| EPS | -2.19 |
| EPS Est Next Qtrly | 0 |
| EPS Est This Year | 0 |
| EPS Est Next Year | 0 |
| Book Value (p.s.) | -1.37 |
| Profit Margin | -70.2 % |
| Operating Margin | -50 % |
| Return on Assets (ttm) | -28.8 % |
| Return on Equity (ttm) | 0 % |
| Qtrly Rev. Growth | -18.5 % |
| Gross Profit (p.s.) | 1.6 |
| Sales Per Share | 4.05 |
| EBITDA (p.s.) | -1.72 |
| Qtrly Earnings Growth | 0 % |
| Operating Cash Flow | -18 (M) |
| Levered Free Cash Flow | 0 (M) |
| PE Ratio | -0.63 |
| PEG Ratio | 0 |
| Price to Book value | -1.01 |
| Price to Sales | 0.33 |
| Price to Cash Flow | -0.9 |
| Dividend | 0 |
| Forward Dividend | 0 |
| Dividend Yield | 0% |
| Dividend Pay Date | Invalid DateTime. |
| Ex-Dividend Date | Invalid DateTime. |