
| 0.0001 0 (0%) | 09-14 16:00 | |||||||||||||
|
|
| Short term |  |
|||
| Mid term | |
|||
| Targets | 6-month : | 1-year : | ||
| Resists | First : | Second : | ||
| Pivot price | ||||
| Supports | First : | Second : | ||
| MAs | MA(5) : | MA(20) : | ||
| MA(100) : | MA(250) : | |||
| MACD | MACD : | Signal : | ||
| %K %D | K(14,3) : | D(3) : | ||
| RSI | RSI(14): | |||
| 52-week | High : | Low : | ||
| If tomorrow: | Open lower | Open higher |
| High: | - | - |
| Low: | - | - |
| Close: | - | - |
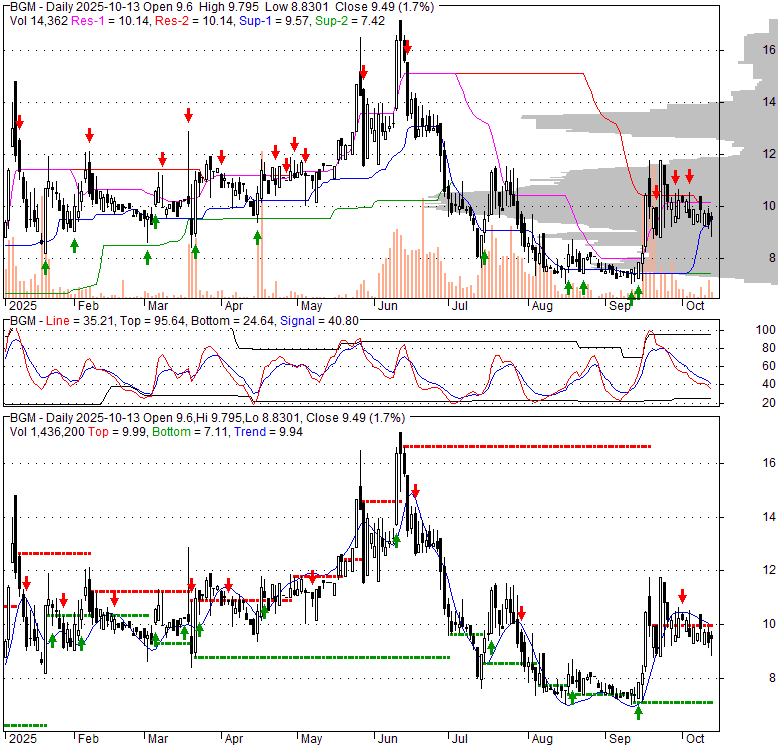
BG Medicine, Inc. is dedicated to the development and commercialization of diagnostic products aimed at guiding patient care for individuals in the United States afflicted with heart failure and related conditions. Its product portfolio includes the BGM Galectin-3 Test, an in vitro diagnostic solution that quantifies galectin-3 levels in blood serum or plasma using an enzyme-linked immunosorbent assay (ELISA) on a microtiter plate platform. Additionally, the company provides the CardioSCORE Test, a multi-analyte, biomarker-based blood test designed to assess the short-term risk of atherothrombotic cardiovascular events, such as myocardial infarction (heart attack) and ischemic stroke. BG Medicine maintains licensing, development, and commercialization agreements with major partners like Abbott Laboratories, bioMérieux SA, Siemens Healthcare Diagnostics Inc., and Alere Inc., specifically for automated versions of its galectin-3 test. Furthermore, it has forged a strategic alliance with Abbott Laboratories to jointly develop and market galectin-3 assay kits, along with their corresponding control kits and calibrators. Founded in 2000, the company was initially known as Beyond Genomics, Inc., before rebranding to BG Medicine, Inc. in October 2004. Its corporate headquarters are located in Waltham, Massachusetts.
Sat, 08 Jun 2024
HLTHQ Stock Price and Chart — OTC:HLTHQ - TradingView
Sun, 01 Jan 2023
Neal Gordon Net Worth (2026) - GuruFocus
Wed, 30 Nov 2022
Jeffrey R Luber Net Worth (2026) - GuruFocus
| Price to Book Value: P/BV, a ratio used to compare book value to its current market price, to gauge whether a stock is valued properly. |
Underperform |
| Price to Earnings: PE, the ratio for valuing a company that measures its current share price relative to its earnings per share (EPS). |
Underperform |
| Discounted cash flow: DCF, a valuation method used to estimate the value of an investment based on its expected future cash flows. |
Underperform |
| Return on Assets: ROA, indicates how profitable a company is in relation to its total assets, how efficiently uses assets to generate a profit. |
Underperform |
| Return on Equity: ROE, a measure of financial performance calculated by dividing net income by equity. a gauge of profitability and efficiency. |
Outperform |
| Debt to Equity: evaluate financial leverage, reflects the ability of equity to cover outstanding debts in the event of a business downturn. |
Underperform |
|
Exchange:
OTC
|
|
|
Sector:
Healthcare
|
|
|
Industry:
Medical - Instruments & Supplies
|
|
| Shares Out | 0 (M) |
| Shares Float | 0 (M) |
| Held by Insiders | (%) |
| Held by Institutions | (%) |
| Shares Short | 0 (K) |
| Shares Short P.Month | 0 (K) |
| EPS | |
| EPS Est Next Qtrly | |
| EPS Est This Year | |
| EPS Est Next Year | |
| Book Value (p.s.) | |
| Profit Margin | % |
| Operating Margin | % |
| Return on Assets (ttm) | % |
| Return on Equity (ttm) | % |
| Qtrly Rev. Growth | % |
| Gross Profit (p.s.) | |
| Sales Per Share | |
| EBITDA (p.s.) | |
| Qtrly Earnings Growth | % |
| Operating Cash Flow | 0 (M) |
| Levered Free Cash Flow | 0 (M) |
| PE Ratio | |
| PEG Ratio | |
| Price to Book value | |
| Price to Sales | |
| Price to Cash Flow |
| Dividend | |
| Forward Dividend | |
| Dividend Yield | 0% |
| Dividend Pay Date | |
| Ex-Dividend Date |

|

|
|

|
|
|
|
|
|