| 18.89 -0.42 (-2.17%) | 05-08 14:55 | |||||||||||||
|
|
| Short term | ||||
| Mid term | |
|||
| Targets | 6-month : | 26.1 | 1-year : | 27.24 |
| Resists | First : | 22.35 | Second : | 23.32 |
| Pivot price | 21.9 |
|||
| Supports | First : | 20.77 | Second : | 17.28 |
| MAs | MA(5) : | 21.5 |
MA(20) : | 22.12 |
| MA(100) : | 24.04 |
MA(250) : | 25.52 |
|
| MACD | MACD : | -0.5 |
Signal : | -0.4 |
| %K %D | K(14,3) : | 22.1 |
D(3) : | 20.4 |
| RSI | RSI(14): 38.7 |
|||
| 52-week | High : | 27.59 | Low : | 20.77 |
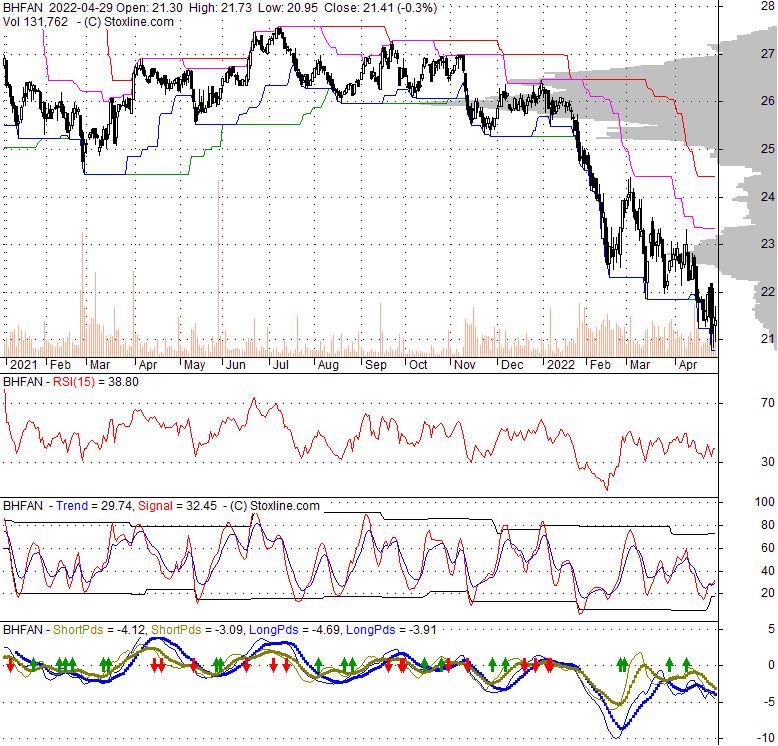
Price has closed below its short-term moving average. Short-term moving average is currently below mid-term; and below long-term moving average. From the relationship between price and moving averages: This stock is BEARISH in short-term; and BEARISH in mid-long term.[ BHFAN ] has closed above bottom band by 25.5%. Bollinger Bands are 33.2% wider than normal. The current width of the bands does not suggest anything about the future direction or movement of prices.
| If tomorrow: | Open lower | Open higher |
| High: | 21.76 - 21.86 | 21.86 - 21.97 |
| Low: | 20.64 - 20.77 | 20.77 - 20.9 |
| Close: | 21.16 - 21.37 | 21.37 - 21.58 |
Brighthouse Financial, Inc. provides annuity and life insurance products in the United States. It operates through three segments: Annuities, Life, and Run-off. The Annuities segment offers variable, fixed, index-linked, and income annuities for contract holders' needs for protected wealth accumulation on a tax-deferred basis, wealth transfer, and income security. The Life segment provides term, universal, whole, and variable life policies for policyholders' needs for financial security and protected wealth transfer. The Run-off segment manages structured settlements, pension risk transfer contracts, certain company-owned life insurance policies, funding agreements, and universal life with secondary guarantees. The company was incorporated in 2016 and is based in Charlotte, North Carolina.
Wed, 08 May 2024
Brighthouse Financial, Inc. 2024 Q1 - Results - Earnings Call Presentation (NASDAQ:BHF) - Seeking Alpha
Sat, 04 May 2024
Brighthouse Financial (NASDAQ:BHFAN) Trading 2.1% Higher - Defense World
Mon, 29 Apr 2024
(BHFAN) Trading Signals - Stock Traders Daily
Fri, 12 Apr 2024
Rebecca Taub Sells 2676 Shares of Madrigal Pharmaceuticals, Inc. (NASDAQ:MDGL) Stock - Defense World
Fri, 12 Apr 2024
Brighthouse Financial, Inc. (NASDAQ:BHFAN) Sees Significant Growth in Short Interest - Defense World
Thu, 15 Feb 2024
Brighthouse Financial Announces Preferred Stock Dividends and Related Depositary Share Distributions - Business Wire
| Price to Book Value: P/BV, a ratio used to compare book value to its current market price, to gauge whether a stock is valued properly. |
Underperform |
| Price to Earnings: PE, the ratio for valuing a company that measures its current share price relative to its earnings per share (EPS). |
Underperform |
| Discounted cash flow: DCF, a valuation method used to estimate the value of an investment based on its expected future cash flows. |
Outperform |
| Return on Assets: ROA, indicates how profitable a company is in relation to its total assets, how efficiently uses assets to generate a profit. |
Underperform |
| Return on Equity: ROE, a measure of financial performance calculated by dividing net income by equity. a gauge of profitability and efficiency. |
Underperform |
| Debt to Equity: evaluate financial leverage, reflects the ability of equity to cover outstanding debts in the event of a business downturn. |
Outperform |
|
Exchange:
NASDAQ
|
|
|
Sector:
Financial Services
|
|
|
Industry:
Insurance - Life
|
|
| Shares Out | 0 (M) |
| Shares Float | 79 (M) |
| Held by Insiders | 0 (%) |
| Held by Institutions | 0 (%) |
| Shares Short | 11 (K) |
| Shares Short P.Month | 9 (K) |
| EPS | -14.89 |
| EPS Est Next Qtrly | 0 |
| EPS Est This Year | 0 |
| EPS Est Next Year | 0 |
| Book Value (p.s.) | 198.02 |
| Profit Margin | -23 % |
| Operating Margin | -26.6 % |
| Return on Assets (ttm) | -0.4 % |
| Return on Equity (ttm) | -7 % |
| Qtrly Rev. Growth | 715.2 % |
| Gross Profit (p.s.) | 312.16 |
| Sales Per Share | 4.82432e+009 |
| EBITDA (p.s.) | 1.51351e+009 |
| Qtrly Earnings Growth | 0 % |
| Operating Cash Flow | 1,020 (M) |
| Levered Free Cash Flow | 5,080 (M) |
| PE Ratio | -1.44 |
| PEG Ratio | 0 |
| Price to Book value | 0.1 |
| Price to Sales | 0 |
| Price to Cash Flow | 0 |
| Dividend | 0 |
| Forward Dividend | 0 |
| Dividend Yield | 0% |
| Dividend Pay Date | 2021-12-26 |
| Ex-Dividend Date | 2021-12-08 |

|

|
|

|
|
|
|
|
|