| 10.185 0.025 (0.25%) | 05-04 13:48 | |||||||||||||
|
|
| Short term | |
|||
| Mid term | |
|||
| Targets | 6-month : | 11.9 | 1-year : | 13.9 |
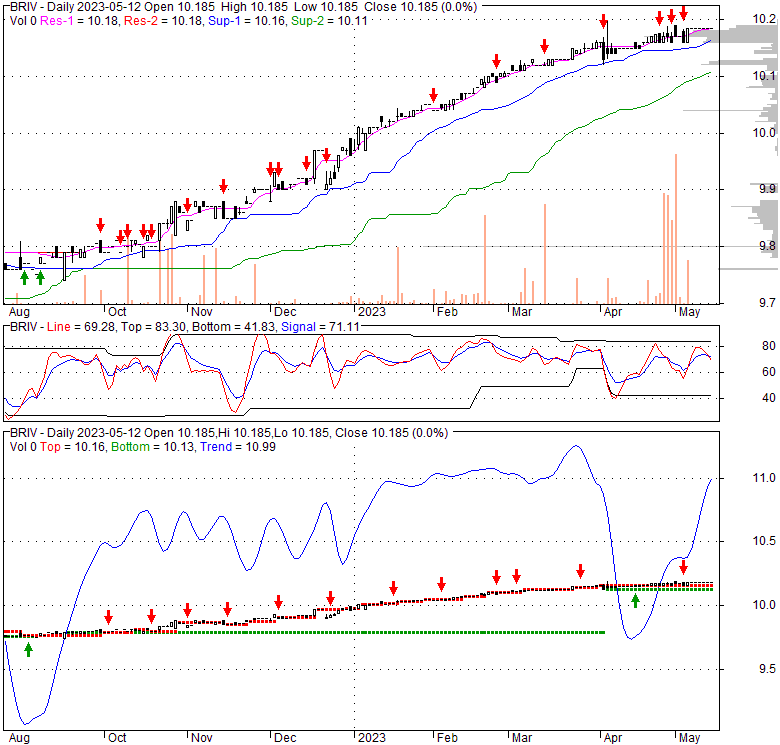
| Resists | First : | 10.18 | Second : | 11.9 |
| Pivot price | 10.17 |
|||
| Supports | First : | 10.15 | Second : | 10.14 |
| MAs | MA(5) : | 10.18 | MA(20) : | 10.17 |
| MA(100) : | 10.09 |
MA(250) : | 9.91 |
|
| MACD | MACD : | 0 |
Signal : | 0 |
| %K %D | K(14,3) : | 83.3 |
D(3) : | 84.3 |
| RSI | RSI(14): 66 | |||
| 52-week | High : | 10.19 | Low : | 9.68 |
Price has closed below its short-term moving average. Short-term moving average is currently above mid-term; and above long-term moving average. From the relationship between price and moving averages: This stock is NEUTRAL in short-term; and BULLISH in mid-long term.[ BRIV ] has closed below upper band by 25.5%. Bollinger Bands are 33.6% narrower than normal. The current width of the bands does not suggest anything about the future direction or movement of prices.
| If tomorrow: | Open lower | Open higher |
| High: | 10.19 - 10.24 | 10.24 - 10.29 |
| Low: | 10.06 - 10.12 | 10.12 - 10.17 |
| Close: | 10.1 - 10.19 | 10.19 - 10.27 |
B. Riley Principal 250 Merger Corp. does not have significant operations. It intends to effect a merger, capital stock exchange, asset acquisition, stock purchase, reorganization, or similar business combination with one or more businesses. The company was incorporated in 2020 and is based in New York, New York. B. Riley Principal 250 Merger Corp. is a subsidiary of B. Riley Financial, Inc.
Fri, 14 Apr 2023
B. RILEY PRINCIPAL 250 MERGER CORP. Management's Discussion and Analysis of Financial Condition and ... - Marketscreener.com
Wed, 08 Feb 2023
Wolfpack Research Short Report Sends B. Riley (RILY) Stock Down 12% - InvestorPlace
Thu, 03 Feb 2022
VMAC Swings, Wag! Gets a SPAC Deal, and DeSPAC TLMD is Going Private at $3 - TheStreet
Tue, 11 Jan 2022
SPACs Bounce. Ex-Redemption Pain. And, Still no Deals - TheStreet
Thu, 06 Jan 2022
Trump-Related SPACs DWAC and CFVI Jump on Truth Social Launch News - TheStreet
Tue, 04 Jan 2022
Still No 2022 SPAC Deal Announcements - Boardroom Alpha - TheStreet
| Price to Book Value: P/BV, a ratio used to compare book value to its current market price, to gauge whether a stock is valued properly. |
Neutral |
| Price to Earnings: PE, the ratio for valuing a company that measures its current share price relative to its earnings per share (EPS). |
Outperform |
| Discounted cash flow: DCF, a valuation method used to estimate the value of an investment based on its expected future cash flows. |
Neutral |
| Return on Assets: ROA, indicates how profitable a company is in relation to its total assets, how efficiently uses assets to generate a profit. |
Outperform |
| Return on Equity: ROE, a measure of financial performance calculated by dividing net income by equity. a gauge of profitability and efficiency. |
Underperform |
| Debt to Equity: evaluate financial leverage, reflects the ability of equity to cover outstanding debts in the event of a business downturn. |
Underperform |
|
Exchange:
NASDAQ
|
|
|
Sector:
Financial Services
|
|
|
Industry:
Shell Companies
|
|
| Shares Out | 18 (M) |
| Shares Float | 15 (M) |
| Held by Insiders | 0 (%) |
| Held by Institutions | 92.2 (%) |
| Shares Short | 2 (K) |
| Shares Short P.Month | 3 (K) |
| EPS | 0.25 |
| EPS Est Next Qtrly | 0 |
| EPS Est This Year | 0 |
| EPS Est Next Year | 0 |
| Book Value (p.s.) | 0.03 |
| Profit Margin | 0 % |
| Operating Margin | 0 % |
| Return on Assets (ttm) | -0.5 % |
| Return on Equity (ttm) | 0 % |
| Qtrly Rev. Growth | 0 % |
| Gross Profit (p.s.) | 0 |
| Sales Per Share | 0 |
| EBITDA (p.s.) | 0 |
| Qtrly Earnings Growth | 0 % |
| Operating Cash Flow | -1 (M) |
| Levered Free Cash Flow | 0 (M) |
| PE Ratio | 40.74 |
| PEG Ratio | 0 |
| Price to Book value | 254.62 |
| Price to Sales | 0 |
| Price to Cash Flow | -299.43 |
| Dividend | 0 |
| Forward Dividend | 0 |
| Dividend Yield | 0% |
| Dividend Pay Date | Invalid DateTime. |
| Ex-Dividend Date | Invalid DateTime. |

|

|
|

|
|
|
|
|
|