
| 15.8337 0.039 (0.25%) | 09-25 16:00 | |||||||||||||
|
|
| Short term |  |
|||
| Mid term | |
|||
| Targets | 6-month : | 18.77  |
1-year : | 18.99 |
| Resists | First : | 16.07 |
Second : | 16.26 |
| Pivot price | 15.98 |
|||
| Supports | First : | 15.78 |
Second : | 13.13 |
| MAs | MA(5) : | 15.88 |
MA(20) : | 16.02 |
| MA(100) : | 16.16 |
MA(250) : | 16.16 |
|
| MACD | MACD : | -0.1 |
Signal : | -0.1 |
| %K %D | K(14,3) : | 8.1  |
D(3) : | 7.7 |
| RSI | RSI(14): 26.8 |
|||
| 52-week | High : | 16.41 | Low : | 15.78 |
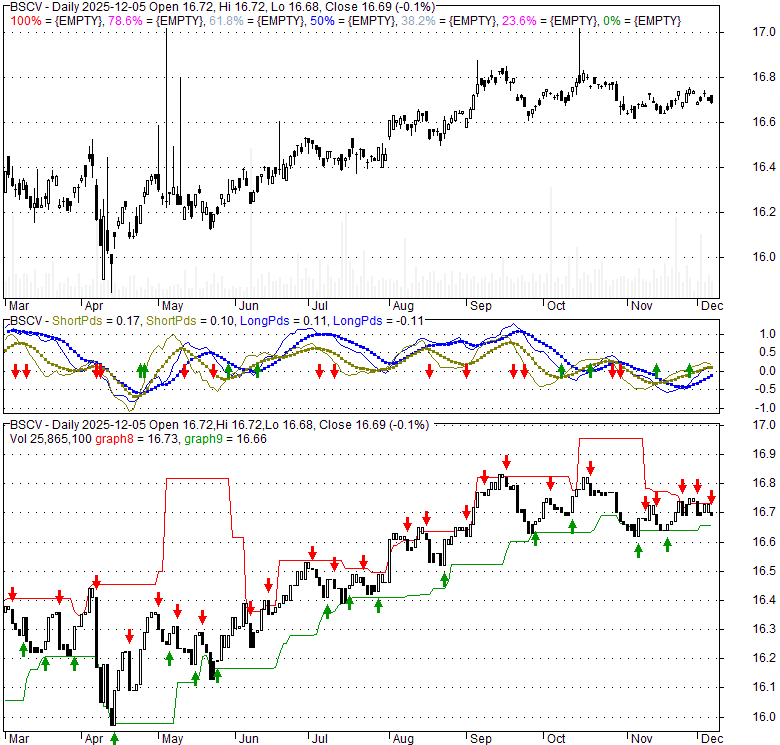
Price has closed below its short-term moving average. Short-term moving average is currently below mid-term; and below long-term moving average. From the relationship between price and moving averages: This stock is BEARISH in short-term; and BEARISH in mid-long term.[ BSCV ] has closed above bottom band by 11.4%. Bollinger Bands are 122.5% wider than normal. The large width of the bands suggest high volatility as compared to its normal range. The bands have been in this wide range for 11 days. This is a sign that the current trend might continue.
| If tomorrow: | Open lower | Open higher |
| High: | 15.86 - 15.95 | 15.95 - 16.03 |
| Low: | 15.54 - 15.66 | 15.66 - 15.77 |
| Close: | 15.66 - 15.83 | 15.83 - 15.99 |
As part of Invesco's BulletShares investment grade suite, BSCV behaves more like a bond than a typical bond fund. The fund provides bullet maturityin this case Dec. 15, 2031instead of perpetual exposure to a maturity pocket of the US corporate investment grade market. As the fund matures, its maturity, duration and YTM will continue to decline. On its target date, BSCV will unwind and return all capital to investors. This structure permits BSCV to be used as a building block for a bond ladder. The fund charges a reasonable fee. Trade BSCV with care during its early days. In all, the fund provides a viable means to access a diverse pool of US investment grade bonds while mimicking the life cycle of an individual bond.
Wed, 23 Sep 2026
Best Performing ETFs: Top Returns at a Glance - TradingKey
Sat, 19 Sep 2026
Invesco BulletShares 2031 Corporate Bond ETF To Go Ex-Dividend On September 21st, 2026 With 0.06342 USD Dividend Per Share - Moomoo
Fri, 17 Apr 2026
Why This $3 Million Buy in a 400-Bond ETF Highlights Long-Term Income Positioning - The Motley Fool
Sun, 02 Nov 2025
What This Fund's $6 Million Exit from a 2027 Bond ETF Should Signal to Long-Term Investors - The Motley Fool
Sun, 02 Nov 2025
Why This Fund Bet $4.6 Million on 2031 Corporate Bonds and Rotated Out of Short-Term Bonds - The Motley Fool
Sun, 05 Jun 2022
Pros And Cons Of Monthly Dividend Stocks - MarketBeat
| Price to Book Value: P/BV, a ratio used to compare book value to its current market price, to gauge whether a stock is valued properly. |
Neutral |
| Price to Earnings: PE, the ratio for valuing a company that measures its current share price relative to its earnings per share (EPS). |
Neutral |
| Discounted cash flow: DCF, a valuation method used to estimate the value of an investment based on its expected future cash flows. |
Neutral |
| Return on Assets: ROA, indicates how profitable a company is in relation to its total assets, how efficiently uses assets to generate a profit. |
Neutral |
| Return on Equity: ROE, a measure of financial performance calculated by dividing net income by equity. a gauge of profitability and efficiency. |
Neutral |
| Debt to Equity: evaluate financial leverage, reflects the ability of equity to cover outstanding debts in the event of a business downturn. |
Neutral |
|
Exchange:
NASDAQ
|
|
|
Sector:
Financial Services
|
|
|
Industry:
Asset Management
|
|
| Shares Out | 0 (M) |
| Shares Float | 0 (M) |
| Held by Insiders | 0 (%) |
| Held by Institutions | 0 (%) |
| Shares Short | 0 (K) |
| Shares Short P.Month | 0 (K) |
| EPS | 0 |
| EPS Est Next Qtrly | 0 |
| EPS Est This Year | 0 |
| EPS Est Next Year | 0 |
| Book Value (p.s.) | 0 |
| Profit Margin | 0 % |
| Operating Margin | 0 % |
| Return on Assets (ttm) | 0 % |
| Return on Equity (ttm) | 0 % |
| Qtrly Rev. Growth | 0 % |
| Gross Profit (p.s.) | 0 |
| Sales Per Share | 0 |
| EBITDA (p.s.) | 0 |
| Qtrly Earnings Growth | 0 % |
| Operating Cash Flow | 0 (M) |
| Levered Free Cash Flow | 0 (M) |
| PE Ratio | 0 |
| PEG Ratio | 0 |
| Price to Book value | 0 |
| Price to Sales | 0 |
| Price to Cash Flow | 0 |
| Dividend | 0 |
| Forward Dividend | 0 |
| Dividend Yield | 0% |
| Dividend Pay Date | Invalid DateTime. |
| Ex-Dividend Date | Invalid DateTime. |

|

|
|

|
|
|
|
|
|