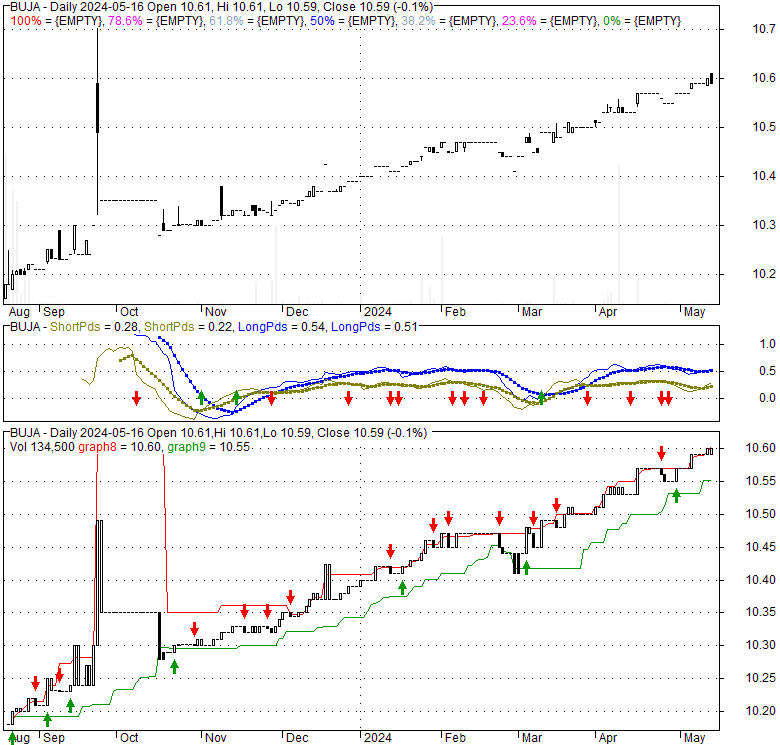
| 10.5504 -0.04 (-0.37%) | 04-25 16:00 | |||||||||||||
|
|
| Short term | |
|||
| Mid term | ||||
| Targets | 6-month : | 12.34 | 1-year : | 14.41 |
| Resists | First : | 10.56 | Second : | 12.34 |
| Pivot price | 10.54 |
|||
| Supports | First : | 10.52 |
Second : | 10.48 |
| MAs | MA(5) : | 10.56 |
MA(20) : | 10.53 |
| MA(100) : | 10.45 |
MA(250) : | 0 | |
| MACD | MACD : | 0 |
Signal : | 0 |
| %K %D | K(14,3) : | 78.1 |
D(3) : | 90.8 |
| RSI | RSI(14): 61.9 |
|||
| 52-week | High : | 10.72 | Low : | 10.17 |
Price has closed below its short-term moving average. Short-term moving average is currently above mid-term; and above long-term moving average. From the relationship between price and moving averages: This stock is NEUTRAL in short-term; and BULLISH in mid-long term.[ BUJA ] has closed below upper band by 42.6%. Bollinger Bands are 9.5% wider than normal. The current width of the bands does not suggest anything about the future direction or movement of prices.
| If tomorrow: | Open lower | Open higher |
| High: | 10.56 - 10.65 | 10.65 - 10.71 |
| Low: | 10.37 - 10.46 | 10.46 - 10.53 |
| Close: | 10.42 - 10.57 | 10.57 - 10.67 |
Bukit Jalil Global Acquisition 1 Ltd operates a blank check company that intends to effect into a merger, share exchange, asset acquisition, share purchase, recapitalization, reorganization, or similar business combination with one or more businesses or entities. The company was incorporated in 2022 and is based in Kuala Lumpur, Malaysia.
Fri, 26 Apr 2024
Wolverine Asset Management LLC Makes New $774,000 Investment in Bukit Jalil Global Acquisition 1 Ltd (NASDAQ ... - MarketBeat
Thu, 25 Apr 2024
Bukit Jalil Global Acquisition 1 (NASDAQ:BUJA) Trading Down 0.1% - MarketBeat
Thu, 25 Apr 2024
Bukit Jalil Global Acquisition 1 (NASDAQ:BUJA) Stock Price Down 0.1% - Defense World
Thu, 17 Aug 2023
Bukit Jalil Global Acquisition 1 Ltd. Announces the Separate Trading of its Ordinary Shares, Warrants, and Rights ... - GlobeNewswire
Tue, 15 Aug 2023
BUJAU Targets High Growth Potential Companies, Embracing M&A Opportunities in the US and Asia - The Edge Malaysia
Tue, 18 Jul 2023
Bujau lists on Nasdaq as regional firms look to go public abroad - The Star Online
| Price to Book Value: P/BV, a ratio used to compare book value to its current market price, to gauge whether a stock is valued properly. |
Outperform |
| Price to Earnings: PE, the ratio for valuing a company that measures its current share price relative to its earnings per share (EPS). |
Outperform |
| Discounted cash flow: DCF, a valuation method used to estimate the value of an investment based on its expected future cash flows. |
Underperform |
| Return on Assets: ROA, indicates how profitable a company is in relation to its total assets, how efficiently uses assets to generate a profit. |
Outperform |
| Return on Equity: ROE, a measure of financial performance calculated by dividing net income by equity. a gauge of profitability and efficiency. |
Underperform |
| Debt to Equity: evaluate financial leverage, reflects the ability of equity to cover outstanding debts in the event of a business downturn. |
Underperform |
|
Exchange:
NASDAQ
|
|
|
Sector:
Financial Services
|
|
|
Industry:
Shell Companies
|
|
| Shares Out | 8 (M) |
| Shares Float | 6 (M) |
| Held by Insiders | 23.9 (%) |
| Held by Institutions | 68.3 (%) |
| Shares Short | 2 (K) |
| Shares Short P.Month | 1 (K) |
| EPS | 0 |
| EPS Est Next Qtrly | 0 |
| EPS Est This Year | 0 |
| EPS Est Next Year | 0 |
| Book Value (p.s.) | 0.56 |
| Profit Margin | 0 % |
| Operating Margin | 0 % |
| Return on Assets (ttm) | -0.3 % |
| Return on Equity (ttm) | 47.5 % |
| Qtrly Rev. Growth | 0 % |
| Gross Profit (p.s.) | 0 |
| Sales Per Share | 0 |
| EBITDA (p.s.) | 0 |
| Qtrly Earnings Growth | 0 % |
| Operating Cash Flow | 0 (M) |
| Levered Free Cash Flow | 0 (M) |
| PE Ratio | 0 |
| PEG Ratio | 0 |
| Price to Book value | 18.5 |
| Price to Sales | 0 |
| Price to Cash Flow | -226.39 |
| Dividend | 0 |
| Forward Dividend | 0 |
| Dividend Yield | 0% |
| Dividend Pay Date | Invalid DateTime. |
| Ex-Dividend Date | Invalid DateTime. |

|

|
|

|
|
|
|
|
|