
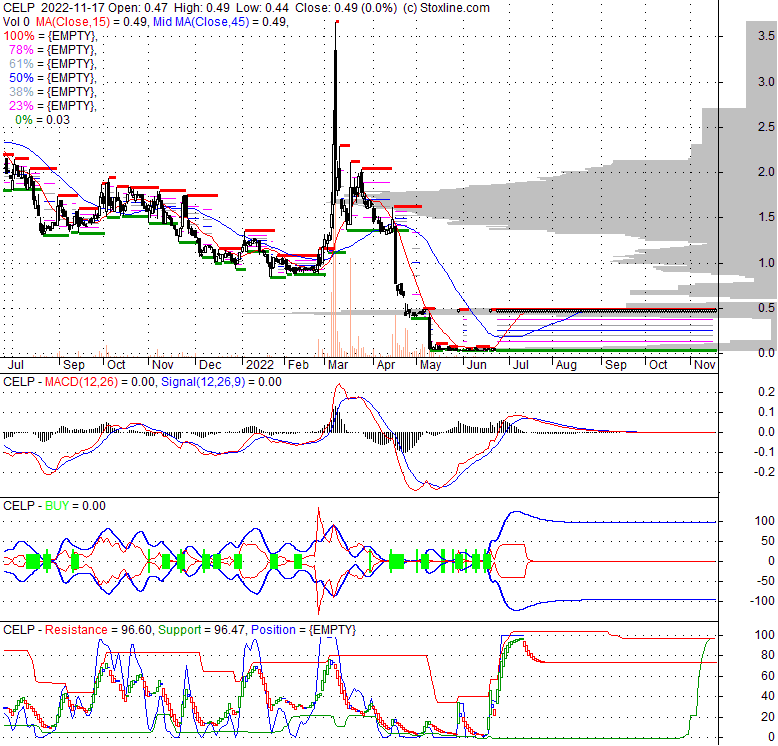
| 0.4883 0 (0%) | 04-24 15:47 | |||||||||||||
|
|
| Short term |  |
|||
| Mid term | |
|||
| Targets | 6-month : | 1-year : | ||
| Resists | First : | Second : | ||
| Pivot price | ||||
| Supports | First : | Second : | ||
| MAs | MA(5) : | MA(20) : | ||
| MA(100) : | MA(250) : | |||
| MACD | MACD : | Signal : | ||
| %K %D | K(14,3) : | D(3) : | ||
| RSI | RSI(14): | |||
| 52-week | High : | Low : | ||
| If tomorrow: | Open lower | Open higher |
| High: | - | - |
| Low: | - | - |
| Close: | - | - |
Cypress Environmental Partners, L.P. furnishes independent inspection, integrity, and various support services throughout North America. The organization is structured into three primary divisions: Inspection Services, Pipeline & Process Services (PPS), and Environmental Services. The Inspection Services segment delivers comprehensive inspection and integrity solutions for diverse infrastructure assets, including midstream pipelines, gathering networks, and distribution systems. Its offerings encompass nondestructive examination, in-line inspection assistance, pig tracking, surveying, data compilation, and oversight of third-party contractors. The PPS segment provides a suite of specialized services such as hydrostatic testing, chemical cleansing, water transfer and recycling, pumping, pigging, flushing, filling, dehydration, caliper runs, support for in-line inspection tools, nitrogen purging, and drying. This segment also manages crucial test documentation and records retention. Within the Environmental Services segment, Cypress owns and operates nine water treatment facilities equipped with ten EPA Class II injection wells. These facilities are situated in the Bakken shale region of North Dakota's Williston Basin. This division is dedicated to the treatment, recovery, separation, and responsible disposal of waste byproducts generated during the entire lifecycle of oil and natural gas wells, thereby safeguarding the environment and potable water sources. The company caters to a broad spectrum of clients, including owners and operators of pipelines and other infrastructure, public utilities or local distribution companies, pipeline construction firms, oil and natural gas exploration and production entities, and trucking companies, alongside third-party purchasers of residual oil. Cypress Environmental Partners GP, LLC functions as the firm's general partner. Established in 2003 and headquartered in Tulsa, Oklahoma, the company adopted its current name, Cypress Environmental Partners, L.P., in March 2020, having previously operated as Cypress Energy Partners, L.P.
Wed, 02 Sep 2026
Cypress Environmental Partners L.P. (CELP) Financials – Balance Sheet, Profit & Loss, Cash Flow - Value Research
Sun, 31 Oct 2021
Crude prices made steady progress on Friday - Oklahoma Energy Today
Tue, 28 Sep 2021
Crude prices weaken but remain strong while Oklahoma energy stocks give up gains - Oklahoma Energy Today
Tue, 24 Aug 2021
Second day of gains for crude oil and Oklahoma energy stocks - Oklahoma Energy Today
| Price to Book Value: P/BV, a ratio used to compare book value to its current market price, to gauge whether a stock is valued properly. |
Neutral |
| Price to Earnings: PE, the ratio for valuing a company that measures its current share price relative to its earnings per share (EPS). |
Outperform |
| Discounted cash flow: DCF, a valuation method used to estimate the value of an investment based on its expected future cash flows. |
Outperform |
| Return on Assets: ROA, indicates how profitable a company is in relation to its total assets, how efficiently uses assets to generate a profit. |
Neutral |
| Return on Equity: ROE, a measure of financial performance calculated by dividing net income by equity. a gauge of profitability and efficiency. |
Neutral |
| Debt to Equity: evaluate financial leverage, reflects the ability of equity to cover outstanding debts in the event of a business downturn. |
Outperform |
|
Exchange:
NYSE
|
|
|
Sector:
Energy
|
|
|
Industry:
Oil & Gas Equipment & Services
|
|
| Shares Out | 0 (M) |
| Shares Float | 0 (M) |
| Held by Insiders | (%) |
| Held by Institutions | (%) |
| Shares Short | 0 (K) |
| Shares Short P.Month | 0 (K) |
| EPS | |
| EPS Est Next Qtrly | |
| EPS Est This Year | |
| EPS Est Next Year | |
| Book Value (p.s.) | |
| Profit Margin | % |
| Operating Margin | % |
| Return on Assets (ttm) | % |
| Return on Equity (ttm) | % |
| Qtrly Rev. Growth | % |
| Gross Profit (p.s.) | |
| Sales Per Share | |
| EBITDA (p.s.) | |
| Qtrly Earnings Growth | % |
| Operating Cash Flow | 0 (M) |
| Levered Free Cash Flow | 0 (M) |
| PE Ratio | |
| PEG Ratio | |
| Price to Book value | |
| Price to Sales | |
| Price to Cash Flow |
| Dividend | |
| Forward Dividend | |
| Dividend Yield | 0% |
| Dividend Pay Date | |
| Ex-Dividend Date |

|

|

|

|
|
|
|
|
|