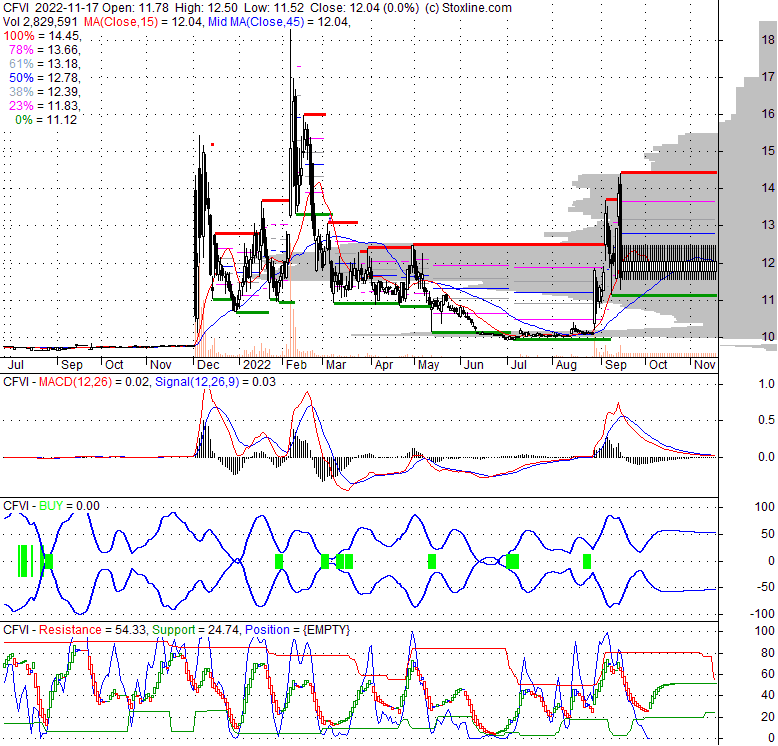
| 12.04 0.42 (3.61%) | 09-19 00:00 | |||||||||||||
|
|
| Short term | |
|||
| Mid term | |
|||
| Targets | 6-month : | 14.59 | 1-year : | 17.05 |
| Resists | First : | 12.5 | Second : | 14.59 |
| Pivot price | 12.03 | |||
| Supports | First : | 11.89 | Second : | 11.52 |
| MAs | MA(5) : | 12.03 | MA(20) : | 12.03 |
| MA(100) : | 11.22 |
MA(250) : | 11.47 |
|
| MACD | MACD : | 0 |
Signal : | 0 |
| %K %D | K(14,3) : | 53 | D(3) : | 53 |
| RSI | RSI(14): 53.9 | |||
| 52-week | High : | 18.52 | Low : | 9.73 |
Price has closed below its short-term moving average. Short-term moving average is currently below mid-term; and above long-term moving average. From the relationship between price and moving averages: This stock is NEUTRAL in short-term; and NEUTRAL in mid-long term.[ CFVI ] has closed Bollinger Bands are 100% narrower than normal. The narrow width of the bands suggests low volatility as compared to its normal range. The bands have been in this narrow range for 31 bars. This is a sign that the market may be about to initiate a new trend.
| If tomorrow: | Open lower | Open higher |
| High: | 12.51 - 12.57 | 12.57 - 12.62 |
| Low: | 11.38 - 11.45 | 11.45 - 11.51 |
| Close: | 11.94 - 12.04 | 12.04 - 12.13 |
CF Acquisition Corp. VI does not have significant operations. It focuses on effecting a merger, capital stock exchange, asset acquisition, stock purchase, reorganization, or similar business combination with one or more businesses in the financial services, healthcare, real estate services, technology, and software industries CF Acquisition Corp. VI was incorporated in 2020 and is based in New York, New York.
Mon, 19 Sep 2022
Right-wing video site Rumble begins trading on Nasdaq via SPAC deal - BetaKit - Canadian Startup News
Thu, 15 Sep 2022
CF Acquisition Rumble SPAC Merger Approved After Shares Soared (NASDAQ:CFVI) - Seeking Alpha
Thu, 15 Sep 2022
CF Acquisition Corp. VI Announces Stockholder Approval of the Proposed Combination with Rumble Inc. - PR Newswire
Tue, 22 Feb 2022
DWAC Stock Pumped by Truth Social Downloads - TheStreet
Mon, 24 Jan 2022
Rumble Is Not the Next YouTube And SPAC CF Acquisition Won't Make It One - Yahoo Finance
Wed, 19 Jan 2022
CF Acquisition Corp VI (CFVI) Up 0.62% in Premarket Trading - InvestorsObserver
| Price to Book Value: P/BV, a ratio used to compare book value to its current market price, to gauge whether a stock is valued properly. |
Underperform |
| Price to Earnings: PE, the ratio for valuing a company that measures its current share price relative to its earnings per share (EPS). |
Neutral |
| Discounted cash flow: DCF, a valuation method used to estimate the value of an investment based on its expected future cash flows. |
Neutral |
| Return on Assets: ROA, indicates how profitable a company is in relation to its total assets, how efficiently uses assets to generate a profit. |
Outperform |
| Return on Equity: ROE, a measure of financial performance calculated by dividing net income by equity. a gauge of profitability and efficiency. |
Underperform |
| Debt to Equity: evaluate financial leverage, reflects the ability of equity to cover outstanding debts in the event of a business downturn. |
Underperform |
|
Exchange:
NASDAQ
|
|
|
Sector:
Financial Services
|
|
|
Industry:
Shell Companies
|
|
| Shares Out | 31 (M) |
| Shares Float | 29 (M) |
| Held by Insiders | 0 (%) |
| Held by Institutions | 19.9 (%) |
| Shares Short | 706 (K) |
| Shares Short P.Month | 584 (K) |
| EPS | -0.02 |
| EPS Est Next Qtrly | 0 |
| EPS Est This Year | 0 |
| EPS Est Next Year | 0 |
| Book Value (p.s.) | -0.25 |
| Profit Margin | 0 % |
| Operating Margin | 0 % |
| Return on Assets (ttm) | 0 % |
| Return on Equity (ttm) | 0 % |
| Qtrly Rev. Growth | 0 % |
| Gross Profit (p.s.) | 0 |
| Sales Per Share | 0 |
| EBITDA (p.s.) | 0 |
| Qtrly Earnings Growth | 0 % |
| Operating Cash Flow | -1 (M) |
| Levered Free Cash Flow | 0 (M) |
| PE Ratio | -602 |
| PEG Ratio | 0 |
| Price to Book value | -48.16 |
| Price to Sales | 0 |
| Price to Cash Flow | -663.47 |
| Dividend | 0 |
| Forward Dividend | 0 |
| Dividend Yield | 0% |
| Dividend Pay Date | Invalid DateTime. |
| Ex-Dividend Date | Invalid DateTime. |

|

|
|

|
|
|
|
|
|