
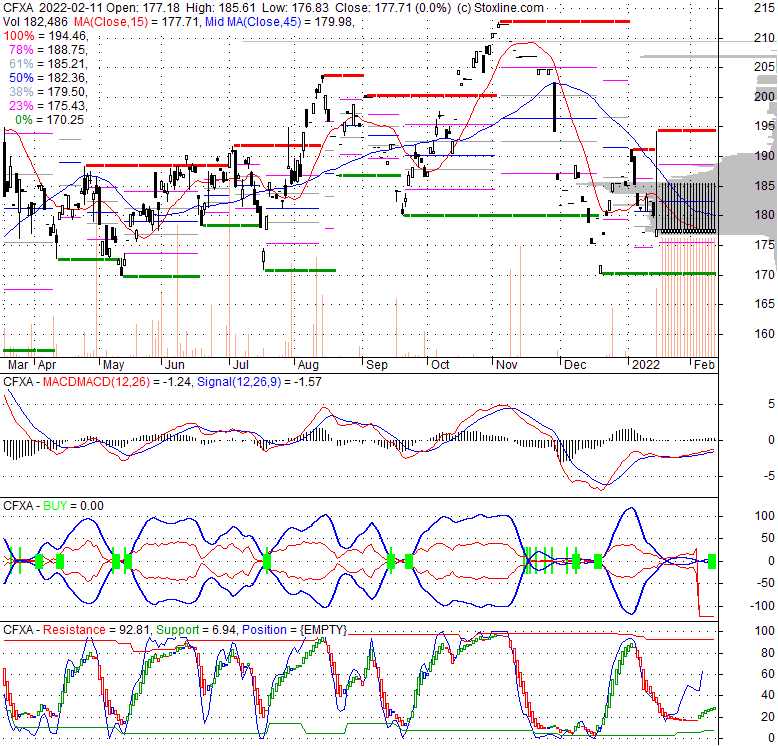
| 177.71 0 (0%) | 04-24 15:47 | |||||||||||||
|
|
| Short term |  |
|||
| Mid term | |
|||
| Targets | 6-month : | 1-year : | ||
| Resists | First : | Second : | ||
| Pivot price | ||||
| Supports | First : | Second : | ||
| MAs | MA(5) : | MA(20) : | ||
| MA(100) : | MA(250) : | |||
| MACD | MACD : | Signal : | ||
| %K %D | K(14,3) : | D(3) : | ||
| RSI | RSI(14): | |||
| 52-week | High : | Low : | ||
| If tomorrow: | Open lower | Open higher |
| High: | - | - |
| Low: | - | - |
| Close: | - | - |
Colfax Corporation operates as a global, diversified technology enterprise. Its operations are divided into two primary divisions: Fabrication Technology and Medical Technology. The Fabrication Technology segment is responsible for the creation, refinement, production, and supply of various consumable products and associated equipment. This includes items for cutting, joining, and automated welding, alongside gas control apparatus. Their offerings encompass welding consumables like electrodes, cored and solid wires, and fluxes, crafted from a range of specialized materials. Additionally, they provide cutting consumables such as electrodes, nozzles, shields, and tips. Products from this segment reach markets including infrastructure, wind energy, marine/life sciences, pipelines, mobile/off-highway machinery, and the oil, gas, and mining sectors. Sales are conducted via independent distributors and direct channels, primarily under the ESAB brand. The Medical Technology segment focuses on developing, manufacturing, and distributing medical devices. These products are utilized by a broad spectrum of healthcare professionals, including orthopedic specialists, spine surgeons, general practitioners, pain management experts, physical therapists, podiatrists, chiropractors, and athletic trainers, to address patients' musculoskeletal conditions. These conditions often stem from degenerative diseases, congenital deformities, traumatic injuries, or sports-related incidents. The product portfolio features rigid and soft orthopedic bracing solutions, hot and cold therapy items, bone growth stimulators, vascular therapy systems with compression garments, therapeutic footwear and inserts, electrical stimulators for pain relief, and various physical therapy tools. Furthermore, this segment offers a comprehensive array of reconstructive joint products for hips, knees, shoulders, elbows, feet, ankles, and fingers. Distribution channels include independent distributors (such as healthcare professionals, consumer retail stores, and pharmacies) as well as direct sales, with the DJO brand being prominent. Colfax Corporation was established in 1860 and maintains its headquarters in Wilmington, Delaware.
Fri, 27 Dec 2024
Share Investing | Share Prices, Performance & Recommendations - intelligentinvestor.com.au
| Price to Book Value: P/BV, a ratio used to compare book value to its current market price, to gauge whether a stock is valued properly. |
Outperform |
| Price to Earnings: PE, the ratio for valuing a company that measures its current share price relative to its earnings per share (EPS). |
Underperform |
| Discounted cash flow: DCF, a valuation method used to estimate the value of an investment based on its expected future cash flows. |
Outperform |
| Return on Assets: ROA, indicates how profitable a company is in relation to its total assets, how efficiently uses assets to generate a profit. |
Neutral |
| Return on Equity: ROE, a measure of financial performance calculated by dividing net income by equity. a gauge of profitability and efficiency. |
Neutral |
| Debt to Equity: evaluate financial leverage, reflects the ability of equity to cover outstanding debts in the event of a business downturn. |
Outperform |
|
Exchange:
NYSE
|
|
|
Sector:
Industrials
|
|
|
Industry:
Industrial - Machinery
|
|
| Shares Out | 0 (M) |
| Shares Float | 0 (M) |
| Held by Insiders | (%) |
| Held by Institutions | (%) |
| Shares Short | 0 (K) |
| Shares Short P.Month | 0 (K) |
| EPS | |
| EPS Est Next Qtrly | |
| EPS Est This Year | |
| EPS Est Next Year | |
| Book Value (p.s.) | |
| Profit Margin | % |
| Operating Margin | % |
| Return on Assets (ttm) | % |
| Return on Equity (ttm) | % |
| Qtrly Rev. Growth | % |
| Gross Profit (p.s.) | |
| Sales Per Share | |
| EBITDA (p.s.) | |
| Qtrly Earnings Growth | % |
| Operating Cash Flow | 0 (M) |
| Levered Free Cash Flow | 0 (M) |
| PE Ratio | |
| PEG Ratio | |
| Price to Book value | |
| Price to Sales | |
| Price to Cash Flow |
| Dividend | |
| Forward Dividend | |
| Dividend Yield | 0% |
| Dividend Pay Date | |
| Ex-Dividend Date |

|

|
|

|
|
|
|
|
|