| 11.29 -0.11 (-0.96%) | 04-26 15:59 | |||||||||||||
|
|
| Short term | |
|||
| Mid term | |
|||
| Targets | 6-month : | 13.74 |
1-year : | 14.57 |
| Resists | First : | 11.76 |
Second : | 12.47 |
| Pivot price | 11.3 |
|||
| Supports | First : | 10.61 |
Second : | 8.83 |
| MAs | MA(5) : | 11.31 |
MA(20) : | 11.3 |
| MA(100) : | 11.18 |
MA(250) : | 10.88 |
|
| MACD | MACD : | 0 |
Signal : | 0 |
| %K %D | K(14,3) : | 16.4 |
D(3) : | 16 |
| RSI | RSI(14): 51 |
|||
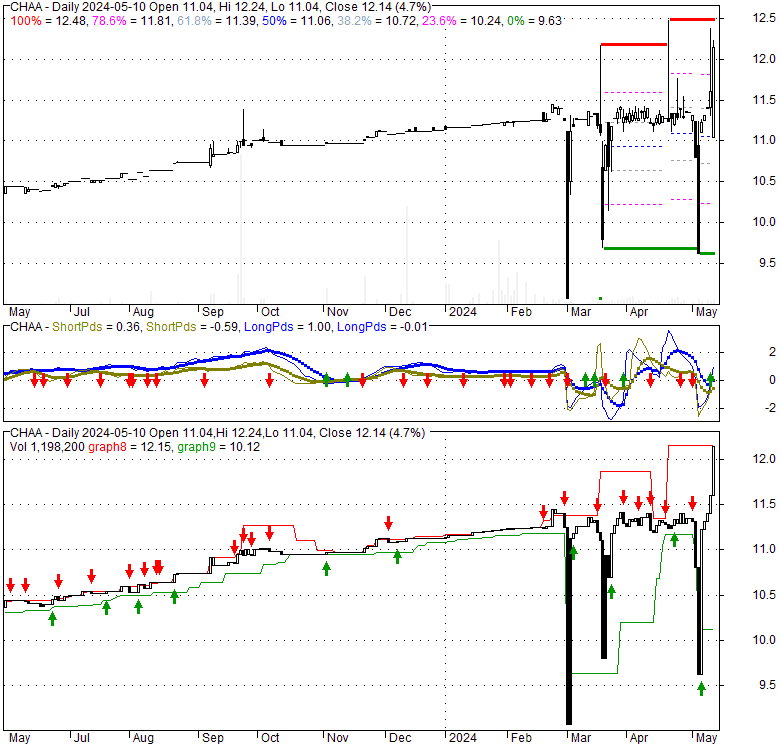
| 52-week | High : | 12.47 | Low : | 9.06 |
Price has closed below its short-term moving average. Short-term moving average is currently above mid-term; and above long-term moving average. From the relationship between price and moving averages: This stock is NEUTRAL in short-term; and BULLISH in mid-long term.[ CHAA ] has closed above bottom band by 45.7%. Bollinger Bands are 61.6% narrower than normal. The narrow width of the bands suggests low volatility as compared to its normal range. The bands have been in this narrow range for 10 bars. This is a sign that the market may be about to initiate a new trend.
| If tomorrow: | Open lower | Open higher |
| High: | 11.36 - 11.41 | 11.41 - 11.46 |
| Low: | 11.16 - 11.22 | 11.22 - 11.27 |
| Close: | 11.2 - 11.3 | 11.3 - 11.38 |
Catcha Investment Corp does not have significant operations. The company focuses on effecting a merger, share exchange, asset acquisition, share purchase, reorganization, or similar business combination with one or more businesses. It intends to identify business opportunities in the field of technology, digital media, financial technology, or digital services sectors. The company was incorporated in 2020 and is based in Singapore.
Sat, 27 Apr 2024
(CHAA) Trading Report - Stock Traders Daily
Mon, 02 Oct 2023
Catcha Investment Corp and Crown LNG Holding AS, Announce Public Filing of a Registration Statement on Form F-4 ... - Business Wire
Thu, 03 Aug 2023
LNG terminal developer Crown to go public via $685 mln SPAC deal - Nasdaq
Thu, 03 Aug 2023
Crown LNG Holdings AS, a Leading Provider of Offshore LNG Liquefaction and Regasification Terminal Infrastructure ... - Business Wire
Fri, 13 Aug 2021
Shorting De-SPACs Could be the Play - TheStreet
Wed, 17 Feb 2021
Catcha Investment Corp Announces Closing of $300000000 Initial Public Offering - Business Wire
| Price to Book Value: P/BV, a ratio used to compare book value to its current market price, to gauge whether a stock is valued properly. |
Outperform |
| Price to Earnings: PE, the ratio for valuing a company that measures its current share price relative to its earnings per share (EPS). |
Underperform |
| Discounted cash flow: DCF, a valuation method used to estimate the value of an investment based on its expected future cash flows. |
Underperform |
| Return on Assets: ROA, indicates how profitable a company is in relation to its total assets, how efficiently uses assets to generate a profit. |
Underperform |
| Return on Equity: ROE, a measure of financial performance calculated by dividing net income by equity. a gauge of profitability and efficiency. |
Underperform |
| Debt to Equity: evaluate financial leverage, reflects the ability of equity to cover outstanding debts in the event of a business downturn. |
Underperform |
|
Exchange:
NYSE
|
|
|
Sector:
Financial Services
|
|
|
Industry:
Shell Companies
|
|
| Shares Out | 2 (M) |
| Shares Float | 2 (M) |
| Held by Insiders | 0 (%) |
| Held by Institutions | 108.8 (%) |
| Shares Short | 0 (K) |
| Shares Short P.Month | 0 (K) |
| EPS | -0.28 |
| EPS Est Next Qtrly | 0 |
| EPS Est This Year | 0 |
| EPS Est Next Year | 0 |
| Book Value (p.s.) | -0.88 |
| Profit Margin | 0 % |
| Operating Margin | 0 % |
| Return on Assets (ttm) | -2.4 % |
| Return on Equity (ttm) | 0 % |
| Qtrly Rev. Growth | 0 % |
| Gross Profit (p.s.) | 0 |
| Sales Per Share | 0 |
| EBITDA (p.s.) | 0 |
| Qtrly Earnings Growth | 0 % |
| Operating Cash Flow | -1 (M) |
| Levered Free Cash Flow | 1 (M) |
| PE Ratio | -41.82 |
| PEG Ratio | 0 |
| Price to Book value | -12.83 |
| Price to Sales | 0 |
| Price to Cash Flow | -24.23 |
| Dividend | 0 |
| Forward Dividend | 0 |
| Dividend Yield | 0% |
| Dividend Pay Date | Invalid DateTime. |
| Ex-Dividend Date | Invalid DateTime. |

|

|
|

|
|
|
|
|
|