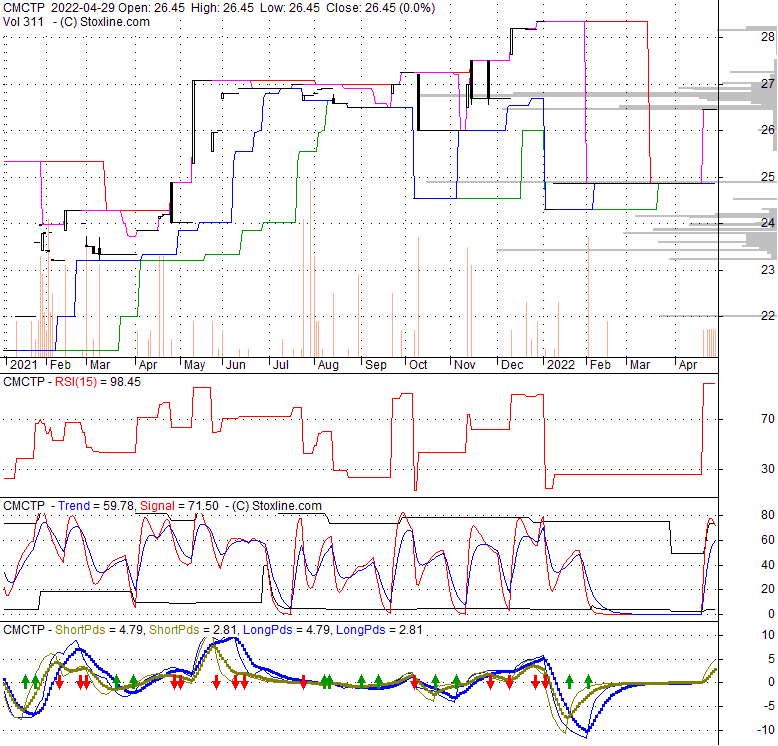
| 29.05 0.04 (0.14%) | 01-18 12:16 | |||||||||||||
|
|
| Short term | |
|||
| Mid term | |
|||
| Targets | 6-month : | 30.89 | 1-year : | 36.08 |
| Resists | First : | 26.45 | Second : | 30.89 |
| Pivot price | 25.6 |
|||
| Supports | First : | 25.47 | Second : | 24.87 |
| MAs | MA(5) : | 26.45 | MA(20) : | 25.42 |
| MA(100) : | 25.55 |
MA(250) : | 26.16 |
|
| MACD | MACD : | 0.4 |
Signal : | 0.2 |
| %K %D | K(14,3) : | 100 | D(3) : | 100 |
| RSI | RSI(14): 98.9 | |||
| 52-week | High : | 28.35 | Low : | 24.02 |
Price has closed below its short-term moving average. Short-term moving average is currently above mid-term; and above long-term moving average. From the relationship between price and moving averages: This stock is NEUTRAL in short-term; and NEUTRAL in mid-long term.[ CMCTP ] has closed below upper band by 23.3%. Bollinger Bands are 118.6% wider than normal. The large width of the bands suggest high volatility as compared to its normal range. The bands have been in this wide range for 5 days. This is a sign that the current trend might continue.
| If tomorrow: | Open lower | Open higher |
| High: | 26.47 - 26.6 | 26.6 - 26.71 |
| Low: | 26.14 - 26.29 | 26.29 - 26.42 |
| Close: | 26.23 - 26.46 | 26.46 - 26.66 |
Creative Media & Community Trust Corporation is a real estate investment trust that primarily acquires, owns, and operates Class A and creative office assets in vibrant and improving metropolitan communities throughout the United States (including improving and developing such assets). Its properties are primarily located in Los Angeles and the San Francisco Bay Area. Creative Media & Community Trust Corporation is operated by affiliates of CIM Group, L.P., a vertically-integrated owner and operator of real assets with multi-disciplinary expertise and in-house research, acquisition, credit analysis, development, finance, leasing, and onsite property management capabilities.
Sat, 27 Apr 2024
Creative Wales grants funding to 31 Welsh media projects - Yahoo News UK
Fri, 26 Apr 2024
Reception for Annual Student Art Show | An exhibition of work from first-year through senior students in the School of ... - Millikin University
Tue, 23 Apr 2024
LECTURER IN DIGITAL MEDIA PRODUCTION job with Texas Tech University | 37644532 - The Chronicle of Higher Education
Tue, 23 Apr 2024
InnaSea Media: a media agency focused on seafood industry - National Fisherman
Mon, 15 Apr 2024
Creative media studio opens in Kemah - Community Impact
Fri, 12 Apr 2024
Kani Kūola Music Festival offers free music and creative media workshops - Maui Now
| Price to Book Value: P/BV, a ratio used to compare book value to its current market price, to gauge whether a stock is valued properly. |
Outperform |
| Price to Earnings: PE, the ratio for valuing a company that measures its current share price relative to its earnings per share (EPS). |
Underperform |
| Discounted cash flow: DCF, a valuation method used to estimate the value of an investment based on its expected future cash flows. |
Outperform |
| Return on Assets: ROA, indicates how profitable a company is in relation to its total assets, how efficiently uses assets to generate a profit. |
Neutral |
| Return on Equity: ROE, a measure of financial performance calculated by dividing net income by equity. a gauge of profitability and efficiency. |
Neutral |
| Debt to Equity: evaluate financial leverage, reflects the ability of equity to cover outstanding debts in the event of a business downturn. |
Outperform |

|
Exchange:
NASDAQ
|
|
|
Sector:
Real Estate
|
|
|
Industry:
REIT - Office
|
|
| Shares Out | 44 (M) |
| Shares Float | 13 (M) |
| Held by Insiders | 0 (%) |
| Held by Institutions | 0 (%) |
| Shares Short | 0 (K) |
| Shares Short P.Month | 0 (K) |
| EPS | -1.45 |
| EPS Est Next Qtrly | 0 |
| EPS Est This Year | 0 |
| EPS Est Next Year | 0 |
| Book Value (p.s.) | 3.24 |
| Profit Margin | -7.1 % |
| Operating Margin | 7.9 % |
| Return on Assets (ttm) | 0.6 % |
| Return on Equity (ttm) | -1.7 % |
| Qtrly Rev. Growth | 39.9 % |
| Gross Profit (p.s.) | 0.68 |
| Sales Per Share | 1.9 |
| EBITDA (p.s.) | 0.61 |
| Qtrly Earnings Growth | 0 % |
| Operating Cash Flow | 20 (M) |
| Levered Free Cash Flow | 20 (M) |
| PE Ratio | -18.37 |
| PEG Ratio | 0 |
| Price to Book value | 8.16 |
| Price to Sales | 13.85 |
| Price to Cash Flow | 59.25 |
| Dividend | 0 |
| Forward Dividend | 0 |
| Dividend Yield | 0% |
| Dividend Pay Date | 2022-01-24 |
| Ex-Dividend Date | 2021-12-29 |