
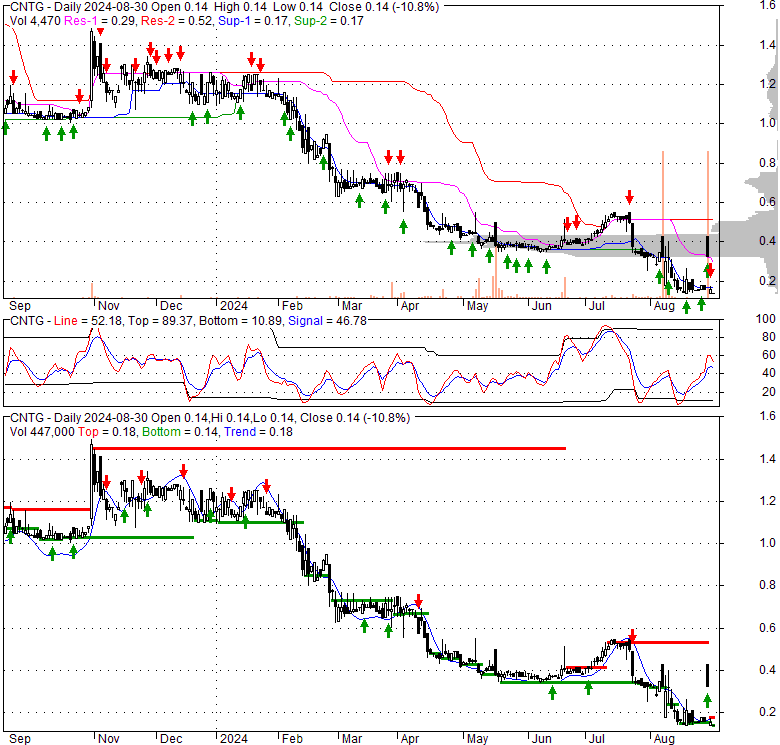
| 0.325 0.325 (100%) | 11-25 16:00 | |||||||||||||
|
|
| Short term |  |
|||
| Mid term | |
|||
| Targets | 6-month : | 1-year : | ||
| Resists | First : | Second : | ||
| Pivot price | ||||
| Supports | First : | Second : | ||
| MAs | MA(5) : | MA(20) : | ||
| MA(100) : | MA(250) : | |||
| MACD | MACD : | Signal : | ||
| %K %D | K(14,3) : | D(3) : | ||
| RSI | RSI(14): | |||
| 52-week | High : | Low : | ||
| If tomorrow: | Open lower | Open higher |
| High: | - | - |
| Low: | - | - |
| Close: | - | - |
Centogene N.V., along with its affiliates, operates globally with a primary focus on rare diseases. The company excels at converting diverse real-world data—spanning clinical, genetic, and other sources—into practical insights for patients, medical professionals, and pharmaceutical enterprises worldwide. Its activities are organized across three core divisions: Pharmaceutical, Diagnostics, and COVID-19 testing. At the heart of Centogene's strategy is its unique rare disease platform, a comprehensive repository of biological samples and integrated data. This platform consolidates epidemiological, phenotypic, and heterogenetic information, significantly improving the identification and ongoing surveillance of rare hereditary conditions. Furthermore, it plays a crucial role in accelerating the development of orphan drugs. The company provides an array of services within its Pharmaceutical segment, including target identification, early patient recruitment, epidemiological intelligence, biomarker discovery, and patient monitoring. Its Diagnostics arm offers genetic sequencing and diagnostic testing, reaching physicians, laboratories, and hospitals directly or through established distribution channels. Centogene also supplies COVID-19 testing solutions, covering both PCR and antigen tests. Established in 2006 and based in Rostock, Germany, Centogene N.V. holds key collaborative and licensing agreements with prominent partners such as Shire International GmbH, Pfizer Inc., Dr. Bauer Laboratoriums GmbH, Fraport AG, Takeda Pharmaceutical Company Limited, and Twist Bioscience Corporation.
Thu, 24 Apr 2025
Centogene N.V. (CNTG) Stock Price, News & Analysis - Stock Titan
Wed, 12 Mar 2025
CENTOGENE Finalizes Private Equity Buyout: What Shareholders Need for Liquidation Payout - Stock Titan
Tue, 18 Jun 2024
Centogene NV (NASDAQ: CNTG) - Share Price - intelligentinvestor.com.au
Mon, 09 Jan 2023
Premier Research and CENTOGENE Launch Strategic Partnership to Accelerate and De-Risk Rare Disease Clinical Development - PR Newswire
Wed, 19 Aug 2020
CENTOGENE Opens Walk-In COVID-19 Testing Facility at Hamburg Airport - GlobeNewswire
| Price to Book Value: P/BV, a ratio used to compare book value to its current market price, to gauge whether a stock is valued properly. |
Underperform |
| Price to Earnings: PE, the ratio for valuing a company that measures its current share price relative to its earnings per share (EPS). |
Underperform |
| Discounted cash flow: DCF, a valuation method used to estimate the value of an investment based on its expected future cash flows. |
Underperform |
| Return on Assets: ROA, indicates how profitable a company is in relation to its total assets, how efficiently uses assets to generate a profit. |
Underperform |
| Return on Equity: ROE, a measure of financial performance calculated by dividing net income by equity. a gauge of profitability and efficiency. |
Underperform |
| Debt to Equity: evaluate financial leverage, reflects the ability of equity to cover outstanding debts in the event of a business downturn. |
Underperform |
|
Exchange:
NASDAQ
|
|
|
Sector:
Healthcare
|
|
|
Industry:
Medical - Diagnostics & Research
|
|
| Shares Out | 0 (M) |
| Shares Float | 0 (M) |
| Held by Insiders | (%) |
| Held by Institutions | (%) |
| Shares Short | 0 (K) |
| Shares Short P.Month | 0 (K) |
| EPS | |
| EPS Est Next Qtrly | |
| EPS Est This Year | |
| EPS Est Next Year | |
| Book Value (p.s.) | |
| Profit Margin | % |
| Operating Margin | % |
| Return on Assets (ttm) | % |
| Return on Equity (ttm) | % |
| Qtrly Rev. Growth | % |
| Gross Profit (p.s.) | |
| Sales Per Share | |
| EBITDA (p.s.) | |
| Qtrly Earnings Growth | % |
| Operating Cash Flow | 0 (M) |
| Levered Free Cash Flow | 0 (M) |
| PE Ratio | |
| PEG Ratio | |
| Price to Book value | |
| Price to Sales | |
| Price to Cash Flow |
| Dividend | |
| Forward Dividend | |
| Dividend Yield | 0% |
| Dividend Pay Date | |
| Ex-Dividend Date |

|

|

|

|
|
|
|
|
|