
| 22.59 -4.16 (-15.55%) | 09-23 14:01 | |||||||||||||
|
|
| Short term |  |
|||
| Mid term |   |
|||
| Targets | 6-month : | 36.09 |
1-year : | 42.15 |
| Resists | First : | 30.89 |
Second : | 36.09 |
| Pivot price | 6.51 |
|||
| Supports | First : | 14.09 |
Second : | 3.7 |
| MAs | MA(5) : | 9.68 |
MA(20) : | 6.44 |
| MA(100) : | 10.94 |
MA(250) : | 0 | |
| MACD | MACD : | 1.6 |
Signal : | 0 |
| %K %D | K(14,3) : | 66.5 |
D(3) : | 45 |
| RSI | RSI(14): 89.6 |
|||
| 52-week | High : | 144.33 | Low : | 3.19 |
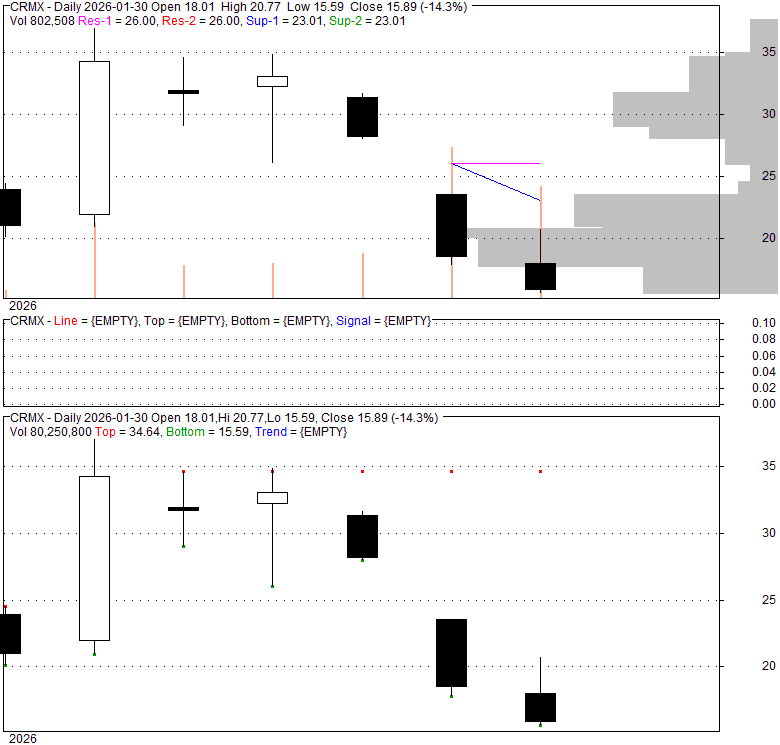
Price has closed above its short-term moving average. Short-term moving average is currently above mid-term; and below long-term moving average. From the relationship between price and moving averages: This stock is BULLISH in short-term; and NEUTRAL in mid-long term.[ CRMX ] has closed above the upper band by 42.2%. If price is in a uptrend band; this upward trend in price might continue. However a short term pullback inside the band is likely.Bollinger Bands are 168.7% wider than normal. The large width of the bands suggest high volatility as compared to its normal range. The bands have been in this wide range for 0 days. This is a sign that the current trend might continue.
| If tomorrow: | Open lower | Open higher |
| High: | 8.52 - 8.56 | 8.56 - 8.59 |
| Low: | 7 - 7.04 | 7.04 - 7.08 |
| Close: | 7.97 - 8.04 | 8.04 - 8.1 |
CRMX is an intraday tactical investment vehicle, specifically designed to provide twice (200%) the daily price performance of Critical Metals Corp. (CRML), before accounting for management fees and operational expenses. The fund's core strategy involves engaging in total return swap agreements with prominent global financial institutions, which are structured to mirror CRML's daily movements. In scenarios where swaps are either unavailable or less efficient, the fund retains the flexibility to utilize FLEX call options or, alternatively, hold CRML common stock directly. Crucially, investors who intend to hold shares for longer than a single trading day must be prepared to frequently monitor and rebalance their positions to maintain the targeted 2x daily leverage. Due to the inherent complexities of this product, its optimal performance is typically observed when the underlying CRML shares exhibit a sustained upward trend, and the investor's market direction aligns with that trend. Prospective investors are strongly advised to conduct their own comprehensive individual stock research prior to initiating any position and to invest with a well-informed strategy. Any residual cash within the fund is strategically allocated to secure collateral assets, including U.S. Treasury securities, money market funds, or short-term corporate debt.
Mon, 21 Sep 2026
Trump, Greenland Deal Sparks CRML Trading Frenzy: These ETFs Rocket 75% - tradingview.com
Sun, 23 Aug 2026
CRMX 260821 12.00C (CRMX260821C12000) Stock Options Chain | Quotes & News - Moomoo
Fri, 10 Jul 2026
USAX ETF Price and Chart — CBOE:USAX - tradingview.com
Tue, 07 Jul 2026
CRMX 260717 12.00P (CRMX260717P12000) Stock Options Chain | Quotes & News - Moomoo
Tue, 26 May 2026
CRMX - Tradr 2X Long CRML Daily ETF Stock Price and Quote - Finviz
Fri, 10 Apr 2026
Most Active Stocks Today: News, Charts, Live Quotes, Graphs - Coinbase
| Price to Book Value: P/BV, a ratio used to compare book value to its current market price, to gauge whether a stock is valued properly. |
Neutral |
| Price to Earnings: PE, the ratio for valuing a company that measures its current share price relative to its earnings per share (EPS). |
Neutral |
| Discounted cash flow: DCF, a valuation method used to estimate the value of an investment based on its expected future cash flows. |
Neutral |
| Return on Assets: ROA, indicates how profitable a company is in relation to its total assets, how efficiently uses assets to generate a profit. |
Neutral |
| Return on Equity: ROE, a measure of financial performance calculated by dividing net income by equity. a gauge of profitability and efficiency. |
Neutral |
| Debt to Equity: evaluate financial leverage, reflects the ability of equity to cover outstanding debts in the event of a business downturn. |
Neutral |
|
Exchange:
CBOE
|
|
|
Sector:
Financial Services
|
|
|
Industry:
Asset Management - Leveraged
|
|
| Shares Out | 0 (M) |
| Shares Float | 0 (M) |
| Held by Insiders | 0 (%) |
| Held by Institutions | 0 (%) |
| Shares Short | 0 (K) |
| Shares Short P.Month | 0 (K) |
| EPS | 0 |
| EPS Est Next Qtrly | 0 |
| EPS Est This Year | 0 |
| EPS Est Next Year | 0 |
| Book Value (p.s.) | 0 |
| Profit Margin | 0 % |
| Operating Margin | 0 % |
| Return on Assets (ttm) | 0 % |
| Return on Equity (ttm) | 0 % |
| Qtrly Rev. Growth | 0 % |
| Gross Profit (p.s.) | 0 |
| Sales Per Share | 0 |
| EBITDA (p.s.) | 0 |
| Qtrly Earnings Growth | 0 % |
| Operating Cash Flow | 0 (M) |
| Levered Free Cash Flow | 0 (M) |
| PE Ratio | 0 |
| PEG Ratio | 0 |
| Price to Book value | 0 |
| Price to Sales | 0 |
| Price to Cash Flow | 0 |
| Dividend | 0 |
| Forward Dividend | 0 |
| Dividend Yield | 0% |
| Dividend Pay Date | Invalid DateTime. |
| Ex-Dividend Date | Invalid DateTime. |

|

|
|

|
|
|
|
|
|