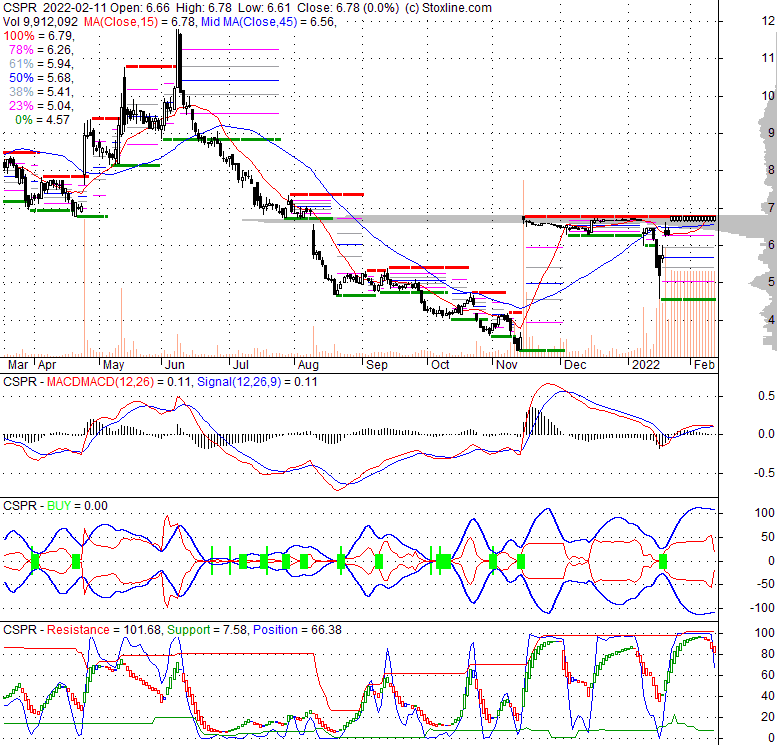
| 6.78 0 (0%) | 12-31 19:00 | |||||||||||||
|
|
| Short term | |
|||
| Mid term | |
|||
| Targets | 6-month : | 7.93 | 1-year : | 9.26 |
| Resists | First : | 6.78 | Second : | 7.93 |
| Pivot price | 6.78 | |||
| Supports | First : | 5.41 | Second : | 4.56 |
| MAs | MA(5) : | 6.78 | MA(20) : | 6.6 |
| MA(100) : | 5.68 |
MA(250) : | 6.83 |
|
| MACD | MACD : | 0.1 |
Signal : | 0.1 |
| %K %D | K(14,3) : | 96.6 |
D(3) : | 97.4 |
| RSI | RSI(14): 59.2 | |||
| 52-week | High : | 12 | Low : | 3.18 |
Price has closed below its short-term moving average. Short-term moving average is currently above mid-term; and above long-term moving average. From the relationship between price and moving averages: This stock is NEUTRAL in short-term; and BULLISH in mid-long term.[ CSPR ] has closed Bollinger Bands are 100% narrower than normal. The narrow width of the bands suggests low volatility as compared to its normal range. The bands have been in this narrow range for 3 bars. This is a sign that the market may be about to initiate a new trend.
| If tomorrow: | Open lower | Open higher |
| High: | - | - |
| Low: | - | - |
| Close: | - | - |
Casper Sleep Inc., together with its subsidiaries, designs and sells sleep products to consumers in the United States, Canada, and Europe. It offers a range of mattresses, pillows, sheets, duvets, bedroom furniture, sleep accessories, sleep technology, and other sleep-centric products and services. As of December 31, 2020, the company distributed its products through its e-commerce platform, 67 Casper retail stores, and 20 retail partners. The company was formerly known as Providence Mattress Company and changed its name to Casper Sleep Inc. in January 2014. Casper Sleep Inc. was incorporated in 2013 and is headquartered in New York, New York.
Tue, 16 Aug 2022
Macy's adds Casper Sleep CEO to board - Bizwomen - The Business Journals
Mon, 24 Jan 2022
Casper Stock: A $0 For Durational (NYSE:CSPR) - Seeking Alpha
Thu, 20 Jan 2022
CSPR Stock Soars on Buyout Approval. 8 Things to Know. - Yahoo Finance
Tue, 04 Jan 2022
Casper Sleep Stock: Fall Asleep & Wake Up To $6.90 Per Share (NYSE:CSPR) - Seeking Alpha
Mon, 15 Nov 2021
Casper Reports Third Quarter Results - Business Wire
Mon, 15 Nov 2021
Casper Sleep Inc. to Be Acquired by Durational Capital Management - Business Wire
| Price to Book Value: P/BV, a ratio used to compare book value to its current market price, to gauge whether a stock is valued properly. |
Underperform |
| Price to Earnings: PE, the ratio for valuing a company that measures its current share price relative to its earnings per share (EPS). |
Underperform |
| Discounted cash flow: DCF, a valuation method used to estimate the value of an investment based on its expected future cash flows. |
Outperform |
| Return on Assets: ROA, indicates how profitable a company is in relation to its total assets, how efficiently uses assets to generate a profit. |
Underperform |
| Return on Equity: ROE, a measure of financial performance calculated by dividing net income by equity. a gauge of profitability and efficiency. |
Outperform |
| Debt to Equity: evaluate financial leverage, reflects the ability of equity to cover outstanding debts in the event of a business downturn. |
Underperform |
|
Exchange:
NYSE
|
|
|
Sector:
Consumer Cyclical
|
|
|
Industry:
Specialty Retail
|
|
| Shares Out | 42 (M) |
| Shares Float | 26 (M) |
| Held by Insiders | 14.5 (%) |
| Held by Institutions | 60.7 (%) |
| Shares Short | 5,740 (K) |
| Shares Short P.Month | 3,180 (K) |
| EPS | -2.32 |
| EPS Est Next Qtrly | 0 |
| EPS Est This Year | 0 |
| EPS Est Next Year | 0 |
| Book Value (p.s.) | -1.04 |
| Profit Margin | -16.3 % |
| Operating Margin | -11.4 % |
| Return on Assets (ttm) | -18.4 % |
| Return on Equity (ttm) | 0 % |
| Qtrly Rev. Growth | 26.7 % |
| Gross Profit (p.s.) | 6.09 |
| Sales Per Share | 14.08 |
| EBITDA (p.s.) | -1.19 |
| Qtrly Earnings Growth | 0 % |
| Operating Cash Flow | -39 (M) |
| Levered Free Cash Flow | -22 (M) |
| PE Ratio | -2.93 |
| PEG Ratio | -0.3 |
| Price to Book value | -6.52 |
| Price to Sales | 0.48 |
| Price to Cash Flow | -7.24 |
| Dividend | 0 |
| Forward Dividend | 0 |
| Dividend Yield | 0% |
| Dividend Pay Date | Invalid DateTime. |
| Ex-Dividend Date | Invalid DateTime. |

|

|
|

|
|
|
|
|
|