| 0 (0%) | 06-28 18:07 | |||||||||||||
|
|
| Short term | |
|||
| Mid term | |
|||
| Targets | 6-month : | 100.68 | 1-year : | 117.59 |
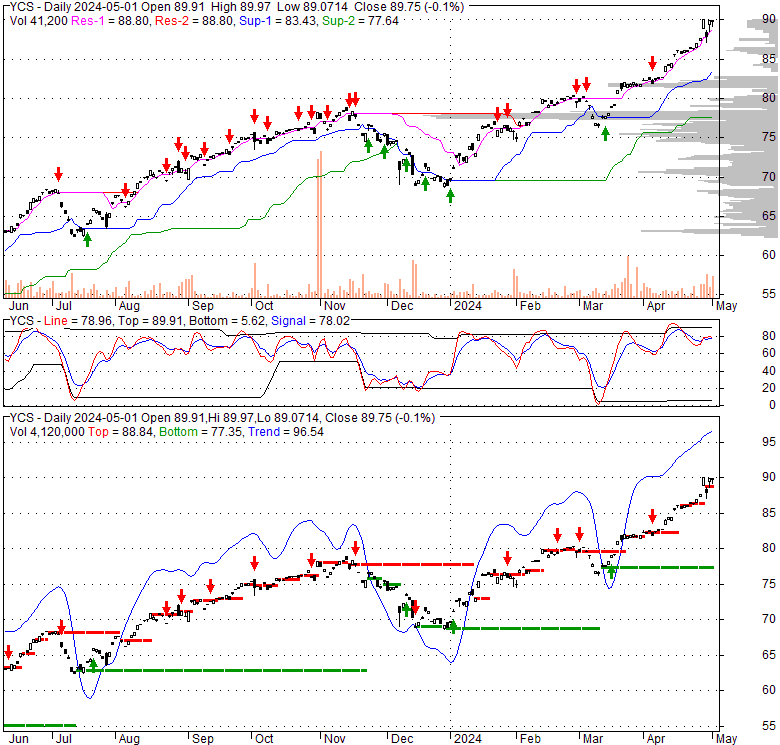
| Resists | First : | 86.19 | Second : | 100.68 |
| Pivot price | 83.66 |
|||
| Supports | First : | 81.02 |
Second : | 77.81 |
| MAs | MA(5) : | 85.6 |
MA(20) : | 83.22 |
| MA(100) : | 77.12 |
MA(250) : | 72.06 |
|
| MACD | MACD : | 1.6 |
Signal : | 1.3 |
| %K %D | K(14,3) : | 95.5 |
D(3) : | 96.1 |
| RSI | RSI(14): 78.3 |
|||
| 52-week | High : | 86.19 | Low : | 56.7 |
Price has closed above its short-term moving average. Short-term moving average is currently above mid-term; and above long-term moving average. From the relationship between price and moving averages: This stock is BULLISH in short-term; and BULLISH in mid-long term.[ YCS ] has closed below upper band by 10.6%. Bollinger Bands are 14.8% wider than normal. The current width of the bands does not suggest anything about the future direction or movement of prices.
| If tomorrow: | Open lower | Open higher |
| High: | 86.25 - 86.59 | 86.59 - 86.88 |
| Low: | 84.84 - 85.27 | 85.27 - 85.64 |
| Close: | 85.39 - 86.08 | 86.08 - 86.68 |
Thu, 18 Apr 2024
Here's Why CYS Investments Stock Is Up 10% Today - Yahoo Movies Canada
Fri, 12 Apr 2024
CYS Investments, Inc. to Present at the Deutsche Bank dbAccess Global Financial Services Investor Co - Yahoo Movies UK
Thu, 10 Dec 2020
A Long List of Mortgage Stocks Grouped by Industry: Are Any Good Buys? - The Truth About Mortgage
Fri, 23 Feb 2018
5 Rock-Solid Dividend Stocks - Seeking Alpha
Sun, 26 Feb 2017
'Safe' Russell Index Review II: Small Cap Russell 2000 Dogs Fetch More Dividends Per Dollar - Seeking Alpha
Tue, 27 Nov 2012
10 Small-Cap Stocks With Aggressive Buyback Plans - Seeking Alpha
| Price to Book Value: P/BV, a ratio used to compare book value to its current market price, to gauge whether a stock is valued properly. |
Neutral |
| Price to Earnings: PE, the ratio for valuing a company that measures its current share price relative to its earnings per share (EPS). |
Underperform |
| Discounted cash flow: DCF, a valuation method used to estimate the value of an investment based on its expected future cash flows. |
Neutral |
| Return on Assets: ROA, indicates how profitable a company is in relation to its total assets, how efficiently uses assets to generate a profit. |
Underperform |
| Return on Equity: ROE, a measure of financial performance calculated by dividing net income by equity. a gauge of profitability and efficiency. |
Underperform |
| Debt to Equity: evaluate financial leverage, reflects the ability of equity to cover outstanding debts in the event of a business downturn. |
Underperform |
|
Exchange:
NYSE
|
|
|
Sector:
|
|
|
Industry:
|
|
| Shares Out | 0 (M) |
| Shares Float | 0 (M) |
| Held by Insiders | 0 (%) |
| Held by Institutions | 0 (%) |
| Shares Short | 0 (K) |
| Shares Short P.Month | 0 (K) |
| EPS | 0 |
| EPS Est Next Qtrly | 0 |
| EPS Est This Year | 0 |
| EPS Est Next Year | 0 |
| Book Value (p.s.) | 0 |
| Profit Margin | 0 % |
| Operating Margin | 0 % |
| Return on Assets (ttm) | 0 % |
| Return on Equity (ttm) | 0 % |
| Qtrly Rev. Growth | 0 % |
| Gross Profit (p.s.) | 0 |
| Sales Per Share | 0 |
| EBITDA (p.s.) | 0 |
| Qtrly Earnings Growth | 0 % |
| Operating Cash Flow | 0 (M) |
| Levered Free Cash Flow | 0 (M) |
| PE Ratio | 0 |
| PEG Ratio | 0 |
| Price to Book value | 0 |
| Price to Sales | 0 |
| Price to Cash Flow | 0 |
| Dividend | 0 |
| Forward Dividend | 0 |
| Dividend Yield | 0% |
| Dividend Pay Date | Invalid DateTime. |
| Ex-Dividend Date | Invalid DateTime. |

|

|
|

|
|
|
|
|
|