
| 1.07 -0.16 (-13.01%) | 10-30 16:00 | |||||||||||||
|
|
| Short term |  |
|||
| Mid term |  |
|||
| Targets | 6-month : | 2.55  |
1-year : | 3.49 |
| Resists | First : | 2.19 |
Second : | 2.99 |
| Pivot price | 1.13 |
|||
| Supports | First : | 0.89 | Second : | 0.74 |
| MAs | MA(5) : | 1.07  |
MA(20) : | 1.23 |
| MA(100) : | 3.7 |
MA(250) : | 6.96 |
|
| MACD | MACD : | -0.4 |
Signal : | -0.5 |
| %K %D | K(14,3) : | 36.5 |
D(3) : | 28.4 |
| RSI | RSI(14): 34.1 |
|||
| 52-week | High : | 47.22 | Low : | 0.89 |
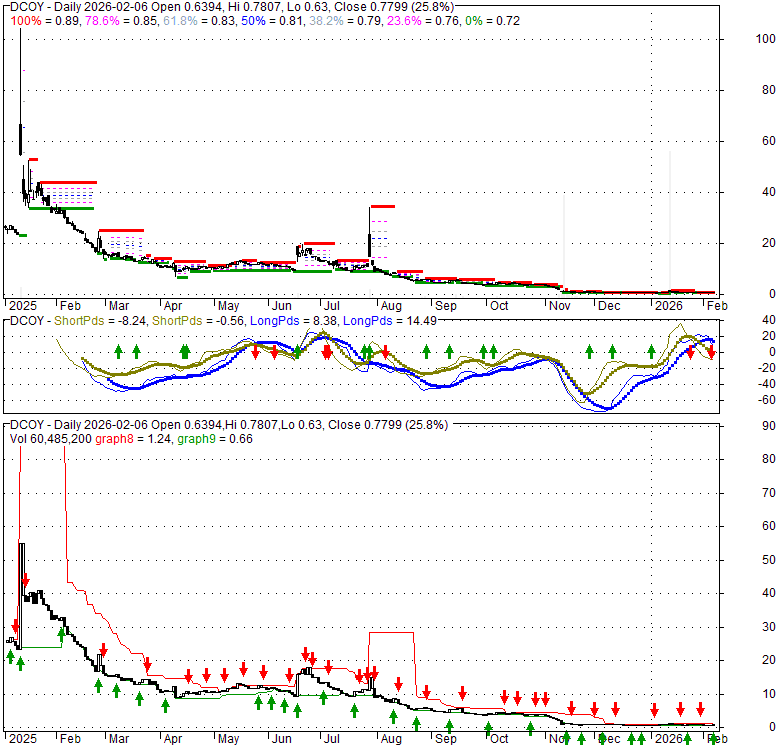
Price has closed below its short-term moving average. Short-term moving average is currently below mid-term; and below long-term moving average. From the relationship between price and moving averages: This stock is BEARISH in short-term; and BEARISH in mid-long term.[ DCOY ] has closed above bottom band by 37.5%. Bollinger Bands are 78% narrower than normal. The narrow width of the bands suggests low volatility as compared to its normal range. The bands have been in this narrow range for 10 bars. This is a sign that the market may be about to initiate a new trend.
| If tomorrow: | Open lower | Open higher |
| High: | 1.23 - 1.24 | 1.24 - 1.24 |
| Low: | 1.04 - 1.04 | 1.04 - 1.05 |
| Close: | 1.06 - 1.07 | 1.07 - 1.08 |
Based in Cambridge, Massachusetts, Decoy Therapeutics Inc. is an early-stage biotechnology firm dedicated to tackling critical unmet medical needs. The company employs cutting-edge machine learning and AI technologies, alongside accelerated synthesis methods, to swiftly design, engineer, and manufacture innovative peptide conjugate drug candidates.
Mon, 19 Oct 2026
Decoy Therapeutics Inc. SEC Filing (Oct 19, 2026) - Stock Titan
Wed, 07 Oct 2026
Decoy Therapeutics Inc (DCOY) Stockholders Plan to Sell 2.37M Sh - GuruFocus
Tue, 29 Sep 2026
Decoy Therapeutics Reports Preclinical Data Supporting Once-Weekly Intranasal Dosing for DCOY-CoV Program - Yahoo Finance
Tue, 22 Sep 2026
DCOY Stock Volatility Draws Trader Attention After Sharp Spike - StocksToTrade
Tue, 22 Sep 2026
Decoy Therapeutics, Inc. (DCOY) Warrants Immediately Exercisable - TradingView
Tue, 22 Sep 2026
/C O R R E C T I O N -- Decoy Therapeutics, Inc/ - PR Newswire
| Price to Book Value: P/BV, a ratio used to compare book value to its current market price, to gauge whether a stock is valued properly. |
Outperform |
| Price to Earnings: PE, the ratio for valuing a company that measures its current share price relative to its earnings per share (EPS). |
Underperform |
| Discounted cash flow: DCF, a valuation method used to estimate the value of an investment based on its expected future cash flows. |
Outperform |
| Return on Assets: ROA, indicates how profitable a company is in relation to its total assets, how efficiently uses assets to generate a profit. |
Underperform |
| Return on Equity: ROE, a measure of financial performance calculated by dividing net income by equity. a gauge of profitability and efficiency. |
Underperform |
| Debt to Equity: evaluate financial leverage, reflects the ability of equity to cover outstanding debts in the event of a business downturn. |
Underperform |
|
Exchange:
NASDAQ
|
|
|
Sector:
Healthcare
|
|
|
Industry:
Biotechnology
|
|
| Shares Out | 0 (M) |
| Shares Float | 2 (M) |
| Held by Insiders | 586440 (%) |
| Held by Institutions | 2.8 (%) |
| Shares Short | 13 (K) |
| Shares Short P.Month | 0 (K) |
| EPS | -6.07e+006 |
| EPS Est Next Qtrly | 0 |
| EPS Est This Year | 0 |
| EPS Est Next Year | 0 |
| Book Value (p.s.) | 0 |
| Profit Margin | 0 % |
| Operating Margin | -1 % |
| Return on Assets (ttm) | 55.8 % |
| Return on Equity (ttm) | -73.4 % |
| Qtrly Rev. Growth | 227630 % |
| Gross Profit (p.s.) | 0 |
| Sales Per Share | -1293.4 |
| EBITDA (p.s.) | -2.54688e+006 |
| Qtrly Earnings Growth | 12.7 % |
| Operating Cash Flow | 0 (M) |
| Levered Free Cash Flow | -8 (M) |
| PE Ratio | -0.01 |
| PEG Ratio | 0 |
| Price to Book value | 0 |
| Price to Sales | -0.01 |
| Price to Cash Flow | 0.08 |
| Dividend | 0 |
| Forward Dividend | 150340 |
| Dividend Yield | 0% |
| Dividend Pay Date | Invalid DateTime. |
| Ex-Dividend Date | Invalid DateTime. |

|

|

|

|
|
|
|
|
|