| 0 (0%) | 04-23 19:11 | |||||||||||||
|
|
| Short term | |
|||
| Mid term | |
|||
| Targets | 6-month : | 28.88 | 1-year : | 29.87 |
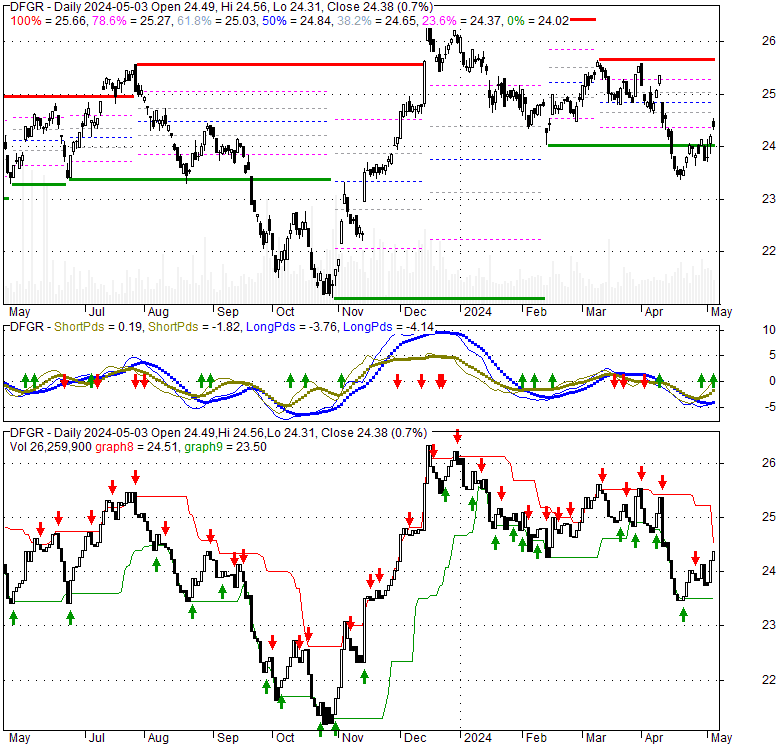
| Resists | First : | 24.73 | Second : | 25.57 |
| Pivot price | 24.25 |
|||
| Supports | First : | 23.36 | Second : | 19.43 |
| MAs | MA(5) : | 23.66 |
MA(20) : | 24.48 |
| MA(100) : | 25 |
MA(250) : | 24.24 |
|
| MACD | MACD : | -0.4 |
Signal : | -0.3 |
| %K %D | K(14,3) : | 21.1 |
D(3) : | 12.6 |
| RSI | RSI(14): 42.6 |
|||
| 52-week | High : | 26.42 | Low : | 21.1 |
Price has closed above its short-term moving average. Short-term moving average is currently below mid-term; and below long-term moving average. From the relationship between price and moving averages: This stock is NEUTRAL in short-term; and BEARISH in mid-long term.[ DFGR ] has closed above bottom band by 40.7%. Bollinger Bands are 74.6% wider than normal. The large width of the bands suggest high volatility as compared to its normal range. The bands have been in this wide range for 5 days. This is a sign that the current trend might continue.
| If tomorrow: | Open lower | Open higher |
| High: | 24.09 - 24.17 | 24.17 - 24.25 |
| Low: | 23.59 - 23.7 | 23.7 - 23.8 |
| Close: | 23.86 - 24.01 | 24.01 - 24.15 |
Fri, 19 Apr 2024
Del Frisco's Restaurant (DFRG) in Focus: Stock Tumbles 7.8% - Yahoo Canada Shine On
Sat, 14 Dec 2019
Del Frisco's Restaurant Group (DFRG) Is Strong On High Volume Today - TheStreet
Sun, 25 Aug 2019
The 6 stages of Charlotte restaurant closing grief - Axios
Mon, 24 Jun 2019
Del Frisco's Restaurant Group, Inc. to Be Acquired by L - GlobeNewswire
Mon, 20 May 2019
Del Frisco's Shares Soar on News of Possible Purchase - TheStreet
Fri, 17 May 2019
Sommelier Talk: Jessica Norris' Steak House Wine Empire at Del Frisco's Restaurant Group - Wine Spectator
| Price to Book Value: P/BV, a ratio used to compare book value to its current market price, to gauge whether a stock is valued properly. |
Outperform |
| Price to Earnings: PE, the ratio for valuing a company that measures its current share price relative to its earnings per share (EPS). |
Underperform |
| Discounted cash flow: DCF, a valuation method used to estimate the value of an investment based on its expected future cash flows. |
Outperform |
| Return on Assets: ROA, indicates how profitable a company is in relation to its total assets, how efficiently uses assets to generate a profit. |
Neutral |
| Return on Equity: ROE, a measure of financial performance calculated by dividing net income by equity. a gauge of profitability and efficiency. |
Neutral |
| Debt to Equity: evaluate financial leverage, reflects the ability of equity to cover outstanding debts in the event of a business downturn. |
Outperform |
|
Exchange:
|
|
|
Sector:
|
|
|
Industry:
|
|
| Shares Out | 0 (M) |
| Shares Float | 0 (M) |
| Held by Insiders | 0 (%) |
| Held by Institutions | 0 (%) |
| Shares Short | 0 (K) |
| Shares Short P.Month | 0 (K) |
| EPS | 0 |
| EPS Est Next Qtrly | 0 |
| EPS Est This Year | 0 |
| EPS Est Next Year | 0 |
| Book Value (p.s.) | 0 |
| Profit Margin | 0 % |
| Operating Margin | 0 % |
| Return on Assets (ttm) | 0 % |
| Return on Equity (ttm) | 0 % |
| Qtrly Rev. Growth | 0 % |
| Gross Profit (p.s.) | 0 |
| Sales Per Share | 0 |
| EBITDA (p.s.) | 0 |
| Qtrly Earnings Growth | 0 % |
| Operating Cash Flow | 0 (M) |
| Levered Free Cash Flow | 0 (M) |
| PE Ratio | 0 |
| PEG Ratio | 0 |
| Price to Book value | 0 |
| Price to Sales | 0 |
| Price to Cash Flow | 0 |
| Dividend | 0 |
| Forward Dividend | 0 |
| Dividend Yield | 0% |
| Dividend Pay Date | Invalid DateTime. |
| Ex-Dividend Date | Invalid DateTime. |

|

|
|

|
|
|
|
|
|