
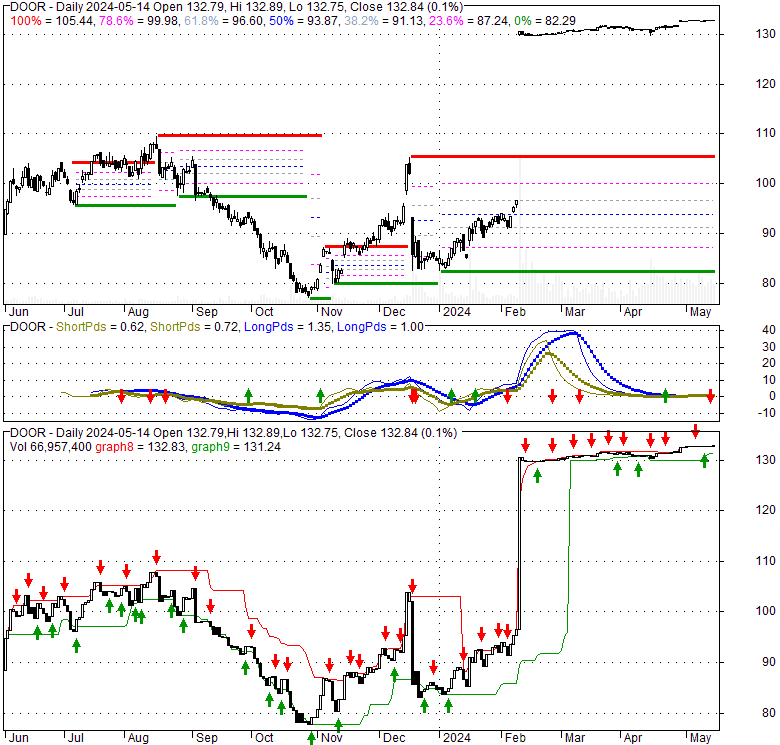
| 132.84 0.07 (0.05%) | 05-14 16:00 | |||||||||||||
|
|
| Short term |  |
|||
| Mid term | |
|||
| Targets | 6-month : | 1-year : | ||
| Resists | First : | Second : | ||
| Pivot price | ||||
| Supports | First : | Second : | ||
| MAs | MA(5) : | MA(20) : | ||
| MA(100) : | MA(250) : | |||
| MACD | MACD : | Signal : | ||
| %K %D | K(14,3) : | D(3) : | ||
| RSI | RSI(14): | |||
| 52-week | High : | Low : | ||
| If tomorrow: | Open lower | Open higher |
| High: | - | - |
| Low: | - | - |
| Close: | - | - |
Masonite International Corporation is a global leader specializing in the design, manufacturing, marketing, and distribution of a comprehensive range of interior and exterior doors. The company's products are vital for new construction projects and also cater to the repair, renovation, and remodeling needs within both residential and non-residential building sectors worldwide. Its extensive product line includes various residential door options such as molded panel, flush, stile and rail, steel, and fiberglass doors. Additionally, Masonite supplies specialized interior doors made from medium-density fiberboard (MDF) and architectural designs. Beyond finished doors, the company also produces a variety of essential door components, including interior door facings, agri-fiber and particleboard door cores, MDF and wood cut-stock parts, and other critical door elements. Masonite markets its offerings under numerous well-known brands, including Masonite, Premdor, Masonite Architectural, Marshfield-Algoma, USA Wood Door, Solidor, Residor, Nicedor, Door-Stop International, Harring Doors, National Hickman, Graham-Maiman, Louisiana Millwork, Baillargeon, and BWI. The company serves a diverse client base, reaching remodeling contractors, builders, homeowners, retailers, dealers, lumberyards, commercial and general contractors, and architects through wholesale, retail, and direct distribution networks. Established in 1925, Masonite International Corporation maintains its headquarters in Tampa, Florida.
Fri, 17 May 2024
OWENS CORNING COMPLETES ACQUISITION OF MASONITE - Building Products Digest
Mon, 06 May 2024
Masonite International Corporation (DOOR) Rose 55% in Q1 - Yahoo Finance
Tue, 20 Feb 2024
Masonite Reports Q4 2023, Full-Year Financials - Window + Door magazine
Mon, 12 Feb 2024
What does Owens Corning get from Masonite acquisition? - Woodworking Network
Mon, 12 Feb 2024
Owens Corning Buys Masonite, Enters Door Business - Qualified Remodeler
| Price to Book Value: P/BV, a ratio used to compare book value to its current market price, to gauge whether a stock is valued properly. |
Outperform |
| Price to Earnings: PE, the ratio for valuing a company that measures its current share price relative to its earnings per share (EPS). |
Neutral |
| Discounted cash flow: DCF, a valuation method used to estimate the value of an investment based on its expected future cash flows. |
Outperform |
| Return on Assets: ROA, indicates how profitable a company is in relation to its total assets, how efficiently uses assets to generate a profit. |
Outperform |
| Return on Equity: ROE, a measure of financial performance calculated by dividing net income by equity. a gauge of profitability and efficiency. |
Outperform |
| Debt to Equity: evaluate financial leverage, reflects the ability of equity to cover outstanding debts in the event of a business downturn. |
Outperform |
|
Exchange:
NYSE
|
|
|
Sector:
Industrials
|
|
|
Industry:
Construction
|
|
| Shares Out | 0 (M) |
| Shares Float | 0 (M) |
| Held by Insiders | (%) |
| Held by Institutions | (%) |
| Shares Short | 0 (K) |
| Shares Short P.Month | 0 (K) |
| EPS | |
| EPS Est Next Qtrly | |
| EPS Est This Year | |
| EPS Est Next Year | |
| Book Value (p.s.) | |
| Profit Margin | % |
| Operating Margin | % |
| Return on Assets (ttm) | % |
| Return on Equity (ttm) | % |
| Qtrly Rev. Growth | % |
| Gross Profit (p.s.) | |
| Sales Per Share | |
| EBITDA (p.s.) | |
| Qtrly Earnings Growth | % |
| Operating Cash Flow | 0 (M) |
| Levered Free Cash Flow | 0 (M) |
| PE Ratio | |
| PEG Ratio | |
| Price to Book value | |
| Price to Sales | |
| Price to Cash Flow |
| Dividend | |
| Forward Dividend | |
| Dividend Yield | 0% |
| Dividend Pay Date | |
| Ex-Dividend Date |

|

|

|

|
|
|
|
|
|