
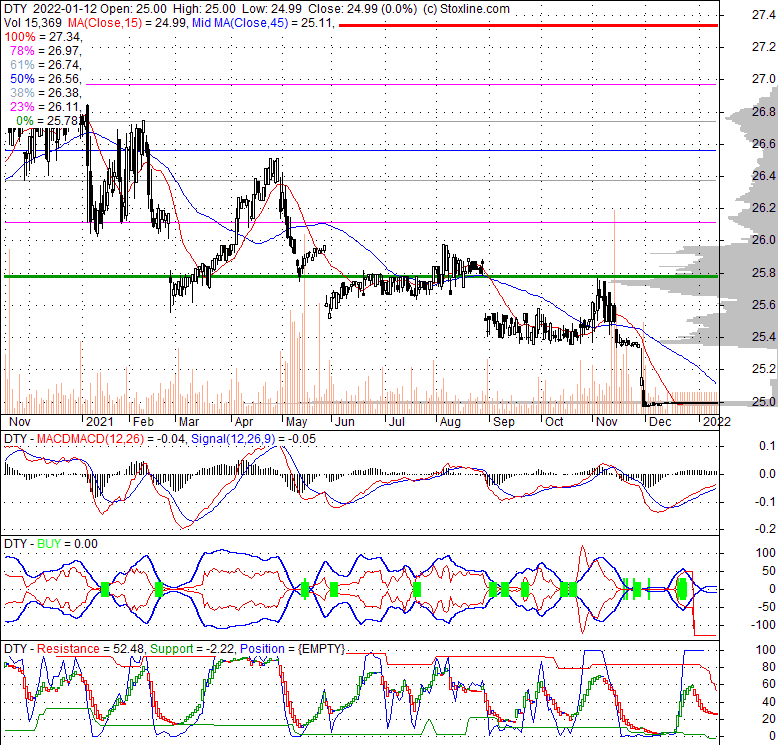
| 24.99 0 (0%) | 12-14 16:00 | |||||||||||||
|
|
| Short term |  |
|||
| Mid term | |
|||
| Targets | 6-month : | 1-year : | ||
| Resists | First : | Second : | ||
| Pivot price | ||||
| Supports | First : | Second : | ||
| MAs | MA(5) : | MA(20) : | ||
| MA(100) : | MA(250) : | |||
| MACD | MACD : | Signal : | ||
| %K %D | K(14,3) : | D(3) : | ||
| RSI | RSI(14): | |||
| 52-week | High : | Low : | ||
| If tomorrow: | Open lower | Open higher |
| High: | - | - |
| Low: | - | - |
| Close: | - | - |
DTE Energy Company operates primarily as a utility provider. Its Electric division is responsible for generating, acquiring, distributing, and selling electrical power to approximately 2.3 million residential, commercial, and industrial clients throughout southeastern Michigan. This power is sourced from a diverse mix of fossil-fuel, hydroelectric pumped storage, nuclear facilities, and renewable assets like wind. The infrastructure for this segment includes around 698 distribution substations and 449,800 line transformers, all owned and operated by DTE. The company's Gas segment manages the procurement, storage, transportation, distribution, and retail sales of natural gas to roughly 1.3 million residential, commercial, and industrial customers across the entire state of Michigan. This unit also offers its excess storage and transportation capacity to others. Its extensive natural gas network comprises approximately 20,000 miles of distribution mains, 1,304,000 service pipelines, and 1,305,000 active meters, alongside roughly 2,000 miles of owned transmission pipelines. Through its Power and Industrial Projects segment, DTE supplies specialized products such as metallurgical coke, pulverized coal, and petroleum coke to industries like steel, pulp and paper. It also delivers crucial industrial services, including power, steam, and chilled water production, wastewater treatment, and compressed air provision. The Energy Trading division is active in the marketing and trading of electricity, natural gas, and environmental commodities. This segment also engages in structured financial transactions and strategically optimizes its contractual positions for natural gas pipeline transportation and storage. Established in 1903, DTE Energy Company's corporate headquarters are situated in Detroit, Michigan.
Mon, 01 Nov 2021
DTE Energy names Joi Harris as president of DTE Gas - Yahoo Finance
Thu, 28 Oct 2021
DTE Energy announces executive leadership changes - Yahoo Finance
| Price to Book Value: P/BV, a ratio used to compare book value to its current market price, to gauge whether a stock is valued properly. |
Outperform |
| Price to Earnings: PE, the ratio for valuing a company that measures its current share price relative to its earnings per share (EPS). |
Outperform |
| Discounted cash flow: DCF, a valuation method used to estimate the value of an investment based on its expected future cash flows. |
Outperform |
| Return on Assets: ROA, indicates how profitable a company is in relation to its total assets, how efficiently uses assets to generate a profit. |
Neutral |
| Return on Equity: ROE, a measure of financial performance calculated by dividing net income by equity. a gauge of profitability and efficiency. |
Neutral |
| Debt to Equity: evaluate financial leverage, reflects the ability of equity to cover outstanding debts in the event of a business downturn. |
Outperform |
|
Exchange:
NYSE
|
|
|
Sector:
Utilities
|
|
|
Industry:
Regulated Electric
|
|
| Shares Out | 0 (M) |
| Shares Float | 0 (M) |
| Held by Insiders | (%) |
| Held by Institutions | (%) |
| Shares Short | 0 (K) |
| Shares Short P.Month | 0 (K) |
| EPS | |
| EPS Est Next Qtrly | |
| EPS Est This Year | |
| EPS Est Next Year | |
| Book Value (p.s.) | |
| Profit Margin | % |
| Operating Margin | % |
| Return on Assets (ttm) | % |
| Return on Equity (ttm) | % |
| Qtrly Rev. Growth | % |
| Gross Profit (p.s.) | |
| Sales Per Share | |
| EBITDA (p.s.) | |
| Qtrly Earnings Growth | % |
| Operating Cash Flow | 0 (M) |
| Levered Free Cash Flow | 0 (M) |
| PE Ratio | |
| PEG Ratio | |
| Price to Book value | |
| Price to Sales | |
| Price to Cash Flow |
| Dividend | |
| Forward Dividend | |
| Dividend Yield | 0% |
| Dividend Pay Date | |
| Ex-Dividend Date |

|

|
|

|
|
|
|
|
|