
| 118.89 -0.06 (-0.05%) | 10-16 16:00 | |||||||||||||
|
|
| Short term |  |
|||
| Mid term |  |
|||
| Targets | 6-month : | 141.71 | 1-year : | 147.35 |
| Resists | First : | 121.33 | Second : | 126.15 |
| Pivot price | 118.38  |
|||
| Supports | First : | 113.52 | Second : | 94.45 |
| MAs | MA(5) : | 119.41  |
MA(20) : | 119.28 |
| MA(100) : | 118.93 |
MA(250) : | 110.72 |
|
| MACD | MACD : | -0.3 |
Signal : | -0.4 |
| %K %D | K(14,3) : | 46.2 |
D(3) : | 46.2 |
| RSI | RSI(14): 49.1 |
|||
| 52-week | High : | 134.44 | Low : | 91.44 |
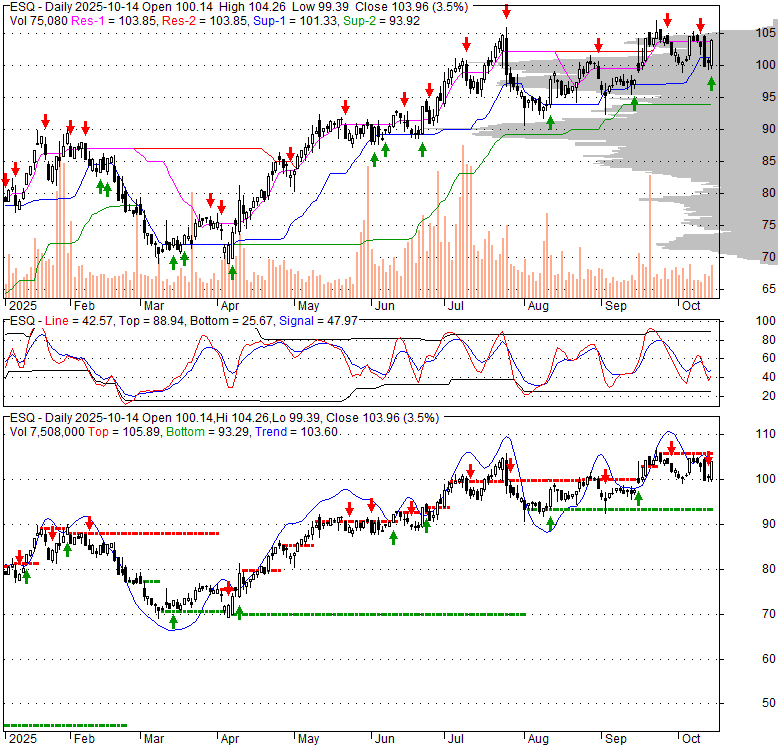
Price has closed below its short-term moving average. Short-term moving average is currently above mid-term; and above long-term moving average. From the relationship between price and moving averages: This stock is NEUTRAL in short-term; and NEUTRAL in mid-long term.[ ESQ ] has closed below upper band by 41.4%. Bollinger Bands are 56.1% narrower than normal. The narrow width of the bands suggests low volatility as compared to its normal range. The bands have been in this narrow range for 1 bars. This is a sign that the market may be about to initiate a new trend.
| If tomorrow: | Open lower | Open higher |
| High: | 120.88 - 121.47 | 121.47 - 122.05 |
| Low: | 116.31 - 117.05 | 117.05 - 117.78 |
| Close: | 117.52 - 118.69 | 118.69 - 119.85 |
Esquire Financial Holdings, Inc. functions as the parent entity for Esquire Bank, National Association, delivering a diverse array of commercial banking and financial services across the United States. Its clientele includes the legal sector, small businesses, and both corporate and individual clients. The company's deposit offerings encompass checking, savings, money market, and time deposits, alongside certificates of deposit. Its lending portfolio is extensive, providing commercial loans tailored for operational liquidity, such as short-term funding for inventory, accounts receivable, or supplies, in addition to financing for approved merchant clientele. It also extends commercial lines of credit. Consumer loan options are available for various needs, including post-settlement and structured settlement financing for plaintiffs and claimants, as well as personal loans to individuals for purposes like consolidating debt, covering medical costs, managing living expenses, or settling outstanding bills. Furthermore, it originates real estate loans for multifamily, single-family residential, commercial properties, and construction projects. Merchant services are another component of its offerings. Established in 2006, Esquire Financial Holdings, Inc. maintains its primary corporate office in Jericho, New York. As of early 2022 (specifically January 25), its physical presence included a full-service branch situated in Jericho, New York, and an administrative hub located in Boca Raton, Florida.
Thu, 15 Oct 2026
Can Esquire Financial (ESQ) Keep the Earnings Surprise Streak Alive? - Yahoo Finance
Thu, 15 Oct 2026
3.45M shares went to Signature holders in Esquire Financial (ESQ)'s completed merger. - Stock Titan
Tue, 13 Oct 2026
Esquire Financial Holdings And 2 Other Growth Companies With Strong Insider Ownership - Simply Wall Street
Mon, 12 Oct 2026
Esquire Financial Holdings: A Quality, Niche Small-Cap Bank With A Premium Valuation - Seeking Alpha
Thu, 08 Oct 2026
Esquire Financial Holdings, Inc. Announces Third Quarter 2026 Earnings Release and Conference Call on October 27, 2026 - Moomoo
Thu, 08 Oct 2026
Results are scheduled for 8:30 a.m. Oct. 27; Esquire Financial's 10 a.m. call includes a Q&A. - Stock Titan
| Price to Book Value: P/BV, a ratio used to compare book value to its current market price, to gauge whether a stock is valued properly. |
Underperform |
| Price to Earnings: PE, the ratio for valuing a company that measures its current share price relative to its earnings per share (EPS). |
Underperform |
| Discounted cash flow: DCF, a valuation method used to estimate the value of an investment based on its expected future cash flows. |
Outperform |
| Return on Assets: ROA, indicates how profitable a company is in relation to its total assets, how efficiently uses assets to generate a profit. |
Outperform |
| Return on Equity: ROE, a measure of financial performance calculated by dividing net income by equity. a gauge of profitability and efficiency. |
Outperform |
| Debt to Equity: evaluate financial leverage, reflects the ability of equity to cover outstanding debts in the event of a business downturn. |
Underperform |
|
Exchange:
NASDAQ
|
|
|
Sector:
Financial Services
|
|
|
Industry:
Banks - Regional
|
|
| Shares Out | 12 (M) |
| Shares Float | 10 (M) |
| Held by Insiders | 12.6 (%) |
| Held by Institutions | 54.1 (%) |
| Shares Short | 1,250 (K) |
| Shares Short P.Month | 853 (K) |
| EPS | 6.05 |
| EPS Est Next Qtrly | 0 |
| EPS Est This Year | 0 |
| EPS Est Next Year | 0 |
| Book Value (p.s.) | 37.88 |
| Profit Margin | 35.2 % |
| Operating Margin | 49.7 % |
| Return on Assets (ttm) | 2.3 % |
| Return on Equity (ttm) | 18.2 % |
| Qtrly Rev. Growth | 21.3 % |
| Gross Profit (p.s.) | 12.33 |
| Sales Per Share | 12.33 |
| EBITDA (p.s.) | 0 |
| Qtrly Earnings Growth | 8 % |
| Operating Cash Flow | 68 (M) |
| Levered Free Cash Flow | 0 (M) |
| PE Ratio | 19.61 |
| PEG Ratio | 0 |
| Price to Book value | 3.13 |
| Price to Sales | 9.63 |
| Price to Cash Flow | 21.29 |
| Dividend | 0.2 |
| Forward Dividend | 0 |
| Dividend Yield | 0.1% |
| Dividend Pay Date | Invalid DateTime. |
| Ex-Dividend Date | Invalid DateTime. |

|

|

|

|
|
|
|
|
|