| 0.2944 0 (0%) | 04-04 16:00 | |||||||||||||
|
|
| Short term | |
|||
| Mid term | |
|||
| Targets | 6-month : | 0.21 | 1-year : | 0.23 |
| Resists | First : | 0.18 | Second : | 0.2 |
| Pivot price | 0.15 | |||
| Supports | First : | 0.15 | Second : | 0.12 |
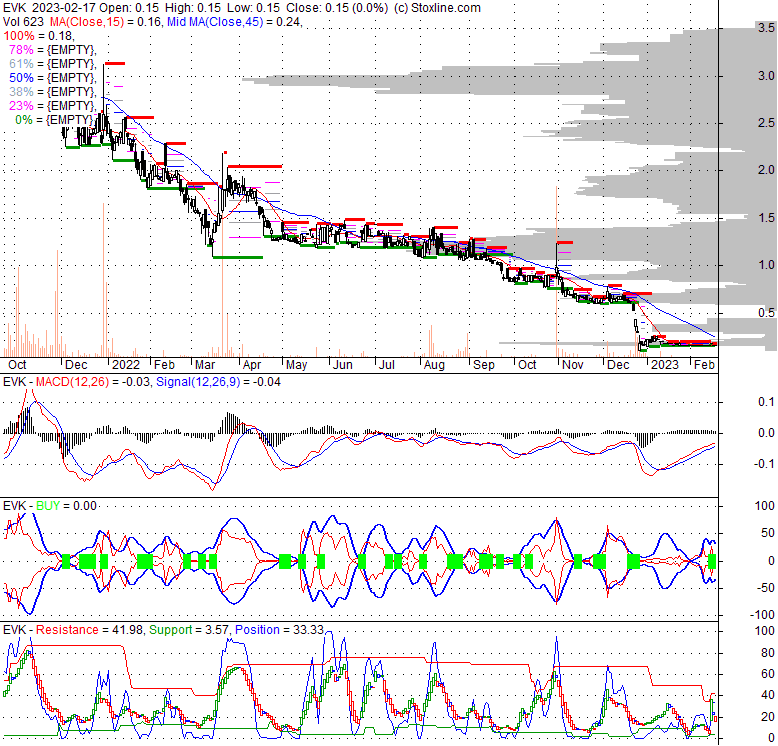
| MAs | MA(5) : | 0.15 | MA(20) : | 0.16 |
| MA(100) : | 0.53 |
MA(250) : | 1.01 |
|
| MACD | MACD : | -0.1 |
Signal : | -0.1 |
| %K %D | K(14,3) : | 33.3 | D(3) : | 33.3 |
| RSI | RSI(14): 35.5 | |||
| 52-week | High : | 2.19 | Low : | 0.1 |
Price has closed below its short-term moving average. Short-term moving average is currently below mid-term; and below long-term moving average. From the relationship between price and moving averages: This stock is BEARISH in short-term; and BEARISH in mid-long term.[ EVK ] has closed above bottom band by 31.0%. Bollinger Bands are 88.4% narrower than normal. The narrow width of the bands suggests low volatility as compared to its normal range. The bands have been in this narrow range for 23 bars. This is a sign that the market may be about to initiate a new trend.
| If tomorrow: | Open lower | Open higher |
| High: | 0.15 - 0.15 | 0.15 - 0.15 |
| Low: | 0.15 - 0.15 | 0.15 - 0.15 |
| Close: | 0.15 - 0.15 | 0.15 - 0.15 |
Ever-Glory International Group, Inc., together with its subsidiaries, manufactures, supplies, and retails apparel in Mainland China, Hong Kong, Germany, the United Kingdom, Europe, Japan, and the United States. It operates through two segments, Wholesale and Retail. The company primarily offers casual wear, outerwear, and sportswear. Its products include coats, jackets, slacks, skirts, shirts, trousers, and jeans for women; vests, jackets, trousers, skiwear, shirts, coats, and jeans for men; and coats, vests, down jackets, trousers, knitwear, and jeans for children. The company offers its woman apparel under the La go go, Velwin, Sea To Sky, Jizhu, and idole brands. It also engages in the import and export of apparel, fabric, and accessories. The company provides its products directly to consumers through retail stores, as well as online stores at Tmall, Dangdang mall, JD.com, VIP.com, etc. As of March 31, 2022, it operated 848 stores in China. The company is based in Nanjing, the Peoples Republic of China.
Thu, 11 Feb 2021
The 9 Best Shoe Stocks to Buy For %currentmonth% %currentyear% - The Stock Dork
Sat, 06 Jul 2019
Ever-Glory International Group, Inc. (NASDAQ: EVK) sales worth was $88M for the first quarter - Switching Fashion
Tue, 14 Aug 2018
Ever-Glory: 2Q Earnings Snapshot - Yahoo Movies UK
Tue, 31 Mar 2015
Morning Market Gainers - BioCryst Pharma (NASDAQ:BCRX), Charter Communications (NASDAQ:CHTR) - Benzinga
| Price to Book Value: P/BV, a ratio used to compare book value to its current market price, to gauge whether a stock is valued properly. |
Neutral |
| Price to Earnings: PE, the ratio for valuing a company that measures its current share price relative to its earnings per share (EPS). |
Underperform |
| Discounted cash flow: DCF, a valuation method used to estimate the value of an investment based on its expected future cash flows. |
Outperform |
| Return on Assets: ROA, indicates how profitable a company is in relation to its total assets, how efficiently uses assets to generate a profit. |
Neutral |
| Return on Equity: ROE, a measure of financial performance calculated by dividing net income by equity. a gauge of profitability and efficiency. |
Neutral |
| Debt to Equity: evaluate financial leverage, reflects the ability of equity to cover outstanding debts in the event of a business downturn. |
Outperform |

|
Exchange:
NASDAQ
|
|
|
Sector:
Consumer Cyclical
|
|
|
Industry:
Apparel - Manufacturers
|
|
| Shares Out | 15 (M) |
| Shares Float | 4 (M) |
| Held by Insiders | 73.1 (%) |
| Held by Institutions | 1.2 (%) |
| Shares Short | 6 (K) |
| Shares Short P.Month | 19 (K) |
| EPS | 0 |
| EPS Est Next Qtrly | 0 |
| EPS Est This Year | 0 |
| EPS Est Next Year | 0 |
| Book Value (p.s.) | 8 |
| Profit Margin | -0.9 % |
| Operating Margin | -0.4 % |
| Return on Assets (ttm) | -0.3 % |
| Return on Equity (ttm) | -2.3 % |
| Qtrly Rev. Growth | 12.6 % |
| Gross Profit (p.s.) | 6.88 |
| Sales Per Share | 23.2 |
| EBITDA (p.s.) | 0.41 |
| Qtrly Earnings Growth | 0 % |
| Operating Cash Flow | 2 (M) |
| Levered Free Cash Flow | -3 (M) |
| PE Ratio | 15.31 |
| PEG Ratio | 0 |
| Price to Book value | 0.01 |
| Price to Sales | 0 |
| Price to Cash Flow | 1.31 |
| Dividend | 0 |
| Forward Dividend | 0 |
| Dividend Yield | 0% |
| Dividend Pay Date | Invalid DateTime. |
| Ex-Dividend Date | Invalid DateTime. |