
| 50.8 0 (0%) | 09-17 16:00 | |||||||||||||
|
|
| Short term |   |
|||
| Mid term |  |
|||
| Targets | 6-month : | 59.4 | 1-year : | 69.38 |
| Resists | First : | 50.86 | Second : | 59.4 |
| Pivot price | 50.78  |
|||
| Supports | First : | 50.74 |
Second : | 50.67 |
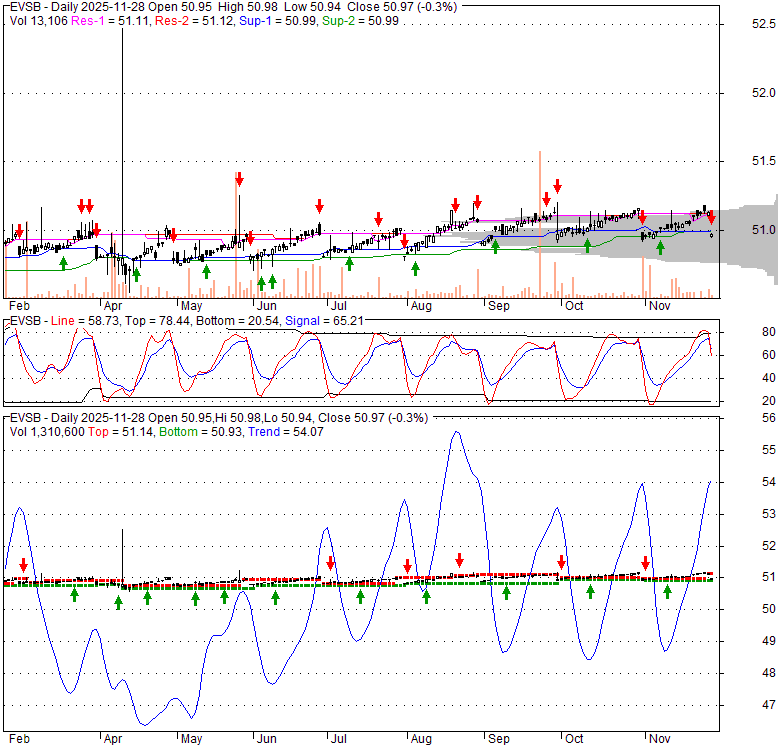
| MAs | MA(5) : | 50.78 |
MA(20) : | 50.77 |
| MA(100) : | 50.45 |
MA(250) : | 49.85 |
|
| MACD | MACD : | 0 |
Signal : | 0 |
| %K %D | K(14,3) : | 54.6 |
D(3) : | 54.3 |
| RSI | RSI(14): 58 |
|||
| 52-week | High : | 50.86 | Low : | 48.77 |
Price has closed below its short-term moving average. Short-term moving average is currently above mid-term; and above long-term moving average. From the relationship between price and moving averages: This stock is NEUTRAL in short-term; and BULLISH in mid-long term.[ EVSB ] has closed above bottom band by 35.1%. Bollinger Bands are 60.3% narrower than normal. The narrow width of the bands suggests low volatility as compared to its normal range. The bands have been in this narrow range for 2 bars. This is a sign that the market may be about to initiate a new trend.
| If tomorrow: | Open lower | Open higher |
| High: | 50.83 - 51.17 | 51.17 - 51.46 |
| Low: | 50.09 - 50.43 | 50.43 - 50.71 |
| Close: | 50.28 - 50.83 | 50.83 - 51.28 |
EVSB is designed to generate increased income while safeguarding principal. It achieves this by primarily allocating its investments to high-quality, short-duration debt instruments. A significant portion of its holdings is concentrated within the banking sector. The fund's portfolio also encompasses U.S. government bonds, pooled investment vehicles, and securities backed by assets or mortgages. While most of its investments are denominated in U.S. dollars, EVSB has the flexibility to allocate up to 25% of its total assets to foreign debt securities. The selection process for these investments involves considering prevailing economic trends, conducting extensive research, and evaluating pertinent environmental, social, and governance (ESG) factors. Although its main focus is on investment-grade assets, the fund can, if deemed appropriate, invest up to 10% of its assets in debt securities rated below investment grade. EVSB aims for a portfolio duration of a year or less, a target that might be extended during times of significant market volatility.
Thu, 05 Mar 2026
MSIM Launches Eaton Vance Preferred Securities and Income ETF - Morgan Stanley
Mon, 10 Nov 2025
MSIM Launches Eaton Vance Income Opportunities ETF - Morgan Stanley
Fri, 07 Mar 2025
3 Fixed Income ETFs for Uncertain Markets - ETF Trends
Wed, 14 Aug 2024
SCUS ETF Price and Chart — AMEX:SCUS - TradingView
Thu, 28 Mar 2024
Look at Ultra-Short Funds While Waiting for Rates - ETF Trends
Mon, 25 Mar 2024
MSIM ETF Assets Surpass $1 Billion with the Conversion of Two Mutual Funds to ETFs - Morgan Stanley
| Price to Book Value: P/BV, a ratio used to compare book value to its current market price, to gauge whether a stock is valued properly. |
Neutral |
| Price to Earnings: PE, the ratio for valuing a company that measures its current share price relative to its earnings per share (EPS). |
Neutral |
| Discounted cash flow: DCF, a valuation method used to estimate the value of an investment based on its expected future cash flows. |
Neutral |
| Return on Assets: ROA, indicates how profitable a company is in relation to its total assets, how efficiently uses assets to generate a profit. |
Neutral |
| Return on Equity: ROE, a measure of financial performance calculated by dividing net income by equity. a gauge of profitability and efficiency. |
Neutral |
| Debt to Equity: evaluate financial leverage, reflects the ability of equity to cover outstanding debts in the event of a business downturn. |
Neutral |
|
Exchange:
AMEX
|
|
|
Sector:
Financial Services
|
|
|
Industry:
Asset Management - Income
|
|
| Shares Out | 0 (M) |
| Shares Float | 0 (M) |
| Held by Insiders | 0 (%) |
| Held by Institutions | 0 (%) |
| Shares Short | 0 (K) |
| Shares Short P.Month | 0 (K) |
| EPS | 0 |
| EPS Est Next Qtrly | 0 |
| EPS Est This Year | 0 |
| EPS Est Next Year | 0 |
| Book Value (p.s.) | 0 |
| Profit Margin | 0 % |
| Operating Margin | 0 % |
| Return on Assets (ttm) | 0 % |
| Return on Equity (ttm) | 0 % |
| Qtrly Rev. Growth | 0 % |
| Gross Profit (p.s.) | 0 |
| Sales Per Share | 0 |
| EBITDA (p.s.) | 0 |
| Qtrly Earnings Growth | 0 % |
| Operating Cash Flow | 0 (M) |
| Levered Free Cash Flow | 0 (M) |
| PE Ratio | 0 |
| PEG Ratio | 0 |
| Price to Book value | 0 |
| Price to Sales | 0 |
| Price to Cash Flow | 0 |
| Dividend | 0 |
| Forward Dividend | 0 |
| Dividend Yield | 0% |
| Dividend Pay Date | Invalid DateTime. |
| Ex-Dividend Date | Invalid DateTime. |

|

|
|

|
|
|
|
|
|