
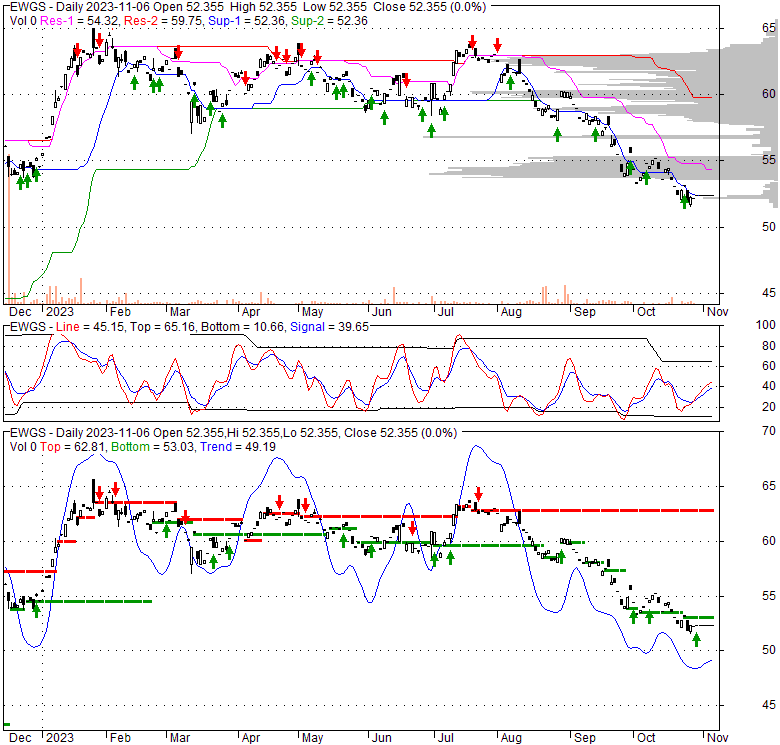
| 52.355 0.165 (0.32%) | 10-30 12:50 | |||||||||||||
|
|
| Short term |  |
|||
| Mid term | |
|||
| Targets | 6-month : | 1-year : | ||
| Resists | First : | Second : | ||
| Pivot price | ||||
| Supports | First : | Second : | ||
| MAs | MA(5) : | MA(20) : | ||
| MA(100) : | MA(250) : | |||
| MACD | MACD : | Signal : | ||
| %K %D | K(14,3) : | D(3) : | ||
| RSI | RSI(14): | |||
| 52-week | High : | Low : | ||
| If tomorrow: | Open lower | Open higher |
| High: | - | - |
| Low: | - | - |
| Close: | - | - |
This fund typically allocates a minimum of 80% of its total assets to the securities comprising its benchmark index, or to other financial instruments possessing substantially similar economic characteristics. The primary objective of this underlying index is to track the investment performance of smaller, publicly traded German corporations.
Tue, 06 Oct 2026
EWG: Weak Trend, Strong Seasonal Pattern (NYSEARCA:EWG) - Seeking Alpha
Wed, 12 Aug 2026
Over 80% of country ETFs are above 50-day MAs as the global rally broadens - Seeking Alpha
Tue, 03 Feb 2026
DAX: What To Know About The ETF That Tracks The 'S&P 500' Of Germany (NASDAQ:DAX) - Seeking Alpha
Tue, 06 Jan 2026
EWG: A Guide To The Premier German ETF (NYSEARCA:EWG) - Seeking Alpha
Thu, 17 Apr 2025
S&P 500: These Countries' Stock Markets Are Racing Ahead Of The U.S. - Investor's Business Daily
Wed, 30 Aug 2023
Germany's Bearish Outlook Puts ETFs Under Spotlight - TradingView
| Price to Book Value: P/BV, a ratio used to compare book value to its current market price, to gauge whether a stock is valued properly. |
Neutral |
| Price to Earnings: PE, the ratio for valuing a company that measures its current share price relative to its earnings per share (EPS). |
Neutral |
| Discounted cash flow: DCF, a valuation method used to estimate the value of an investment based on its expected future cash flows. |
Neutral |
| Return on Assets: ROA, indicates how profitable a company is in relation to its total assets, how efficiently uses assets to generate a profit. |
Neutral |
| Return on Equity: ROE, a measure of financial performance calculated by dividing net income by equity. a gauge of profitability and efficiency. |
Neutral |
| Debt to Equity: evaluate financial leverage, reflects the ability of equity to cover outstanding debts in the event of a business downturn. |
Neutral |
|
Exchange:
CBOE
|
|
|
Sector:
Financial Services
|
|
|
Industry:
Asset Management - Global
|
|
| Shares Out | 0 (M) |
| Shares Float | 0 (M) |
| Held by Insiders | (%) |
| Held by Institutions | (%) |
| Shares Short | 0 (K) |
| Shares Short P.Month | 0 (K) |
| EPS | |
| EPS Est Next Qtrly | |
| EPS Est This Year | |
| EPS Est Next Year | |
| Book Value (p.s.) | |
| Profit Margin | % |
| Operating Margin | % |
| Return on Assets (ttm) | % |
| Return on Equity (ttm) | % |
| Qtrly Rev. Growth | % |
| Gross Profit (p.s.) | |
| Sales Per Share | |
| EBITDA (p.s.) | |
| Qtrly Earnings Growth | % |
| Operating Cash Flow | 0 (M) |
| Levered Free Cash Flow | 0 (M) |
| PE Ratio | |
| PEG Ratio | |
| Price to Book value | |
| Price to Sales | |
| Price to Cash Flow |
| Dividend | |
| Forward Dividend | |
| Dividend Yield | 0% |
| Dividend Pay Date | |
| Ex-Dividend Date |

|

|

|

|
|
|
|
|
|