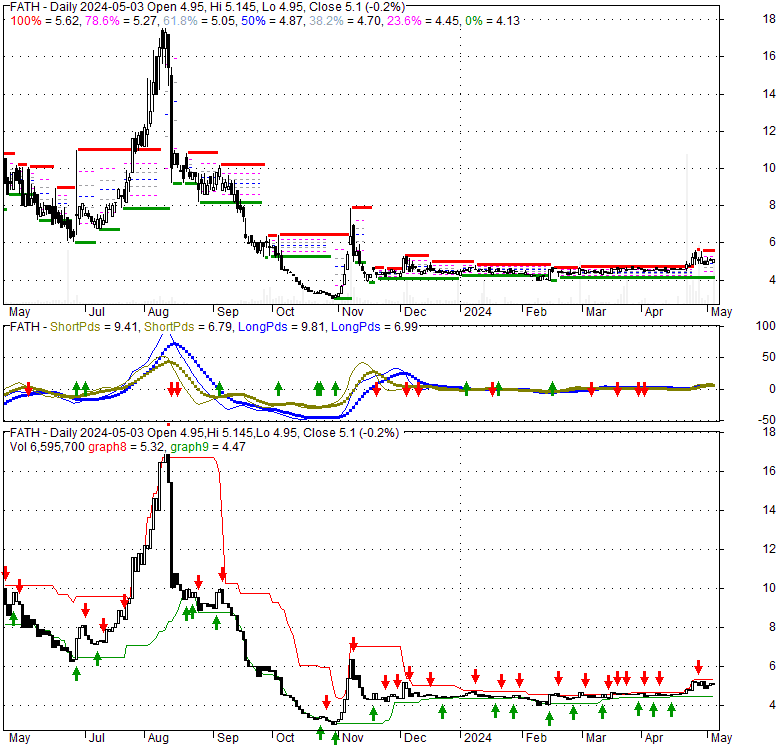
| 4.59 -0.015 (-0.33%) | 04-19 15:11 | |||||||||||||
|
|
| Short term | |
|||
| Mid term | ||||
| Targets | 6-month : | 5.5 | 1-year : | 6.42 |
| Resists | First : | 4.71 | Second : | 5.5 |
| Pivot price | 4.54 |
|||
| Supports | First : | 4.45 | Second : | 4.3 |
| MAs | MA(5) : | 4.57 |
MA(20) : | 4.55 |
| MA(100) : | 4.48 |
MA(250) : | 6.41 |
|
| MACD | MACD : | 0 |
Signal : | 0 |
| %K %D | K(14,3) : | 64.9 |
D(3) : | 57.9 |
| RSI | RSI(14): 53.6 |
|||
| 52-week | High : | 18 | Low : | 2.99 |
Price has closed above its short-term moving average. Short-term moving average is currently above mid-term; and above long-term moving average. From the relationship between price and moving averages: This stock is BULLISH in short-term; and BULLISH in mid-long term.[ FATH ] has closed below upper band by 28.3%. Bollinger Bands are 62.3% narrower than normal. The narrow width of the bands suggests low volatility as compared to its normal range. The bands have been in this narrow range for 101 bars. This is a sign that the market may be about to initiate a new trend.
| If tomorrow: | Open lower | Open higher |
| High: | 4.59 - 4.62 | 4.62 - 4.63 |
| Low: | 4.51 - 4.54 | 4.54 - 4.56 |
| Close: | 4.55 - 4.59 | 4.59 - 4.62 |
Fathom Digital Manufacturing Corporation, a digital manufacturing platform, provides product development and manufacturing services in North America. It provides plastic and metal additive manufacturing, computer numerical control machining, injection molding and tooling, precision sheet metal fabrication, design engineering, urethane casting, and chemical etching. The company serves the technology, defense, aerospace, medical, automotive, and IOT sectors. The company was founded in 1984 and is headquartered in Hartland, Wisconsin.
Thu, 18 Apr 2024
Fathom Digital Manufacturing Faces Hurdles as Merger with CORE Investors Looms - TipRanks.com - TipRanks
Tue, 16 Apr 2024
Fathom Digital Manufacturing Corporation Reports Earnings Results for the Full Year Ended December 31, 2023 - Marketscreener.com
Tue, 20 Feb 2024
Fathom Digital Announces Major Merger with CORE Affiliates - TipRanks.com - TipRanks
Mon, 27 Nov 2023
Hartland-based manufacturer weighs bid to go private - Milwaukee Business Journal - The Business Journals
Sun, 26 Nov 2023
Fathom Digital Manufacturing holder offers to buy company for $4.50 a share - Seeking Alpha
Wed, 15 Nov 2023
Fathom reports revenues of $31.5 million in Q3 2023, -21.8% - VoxelMatters
| Price to Book Value: P/BV, a ratio used to compare book value to its current market price, to gauge whether a stock is valued properly. |
Underperform |
| Price to Earnings: PE, the ratio for valuing a company that measures its current share price relative to its earnings per share (EPS). |
Neutral |
| Discounted cash flow: DCF, a valuation method used to estimate the value of an investment based on its expected future cash flows. |
Underperform |
| Return on Assets: ROA, indicates how profitable a company is in relation to its total assets, how efficiently uses assets to generate a profit. |
Outperform |
| Return on Equity: ROE, a measure of financial performance calculated by dividing net income by equity. a gauge of profitability and efficiency. |
Outperform |
| Debt to Equity: evaluate financial leverage, reflects the ability of equity to cover outstanding debts in the event of a business downturn. |
Outperform |

|
Exchange:
NYSE
|
|
|
Sector:
Technology
|
|
|
Industry:
Computer Hardware
|
|
| Shares Out | 4 (M) |
| Shares Float | 2 (M) |
| Held by Insiders | 15.7 (%) |
| Held by Institutions | 62.1 (%) |
| Shares Short | 18 (K) |
| Shares Short P.Month | 8 (K) |
| EPS | -17.56 |
| EPS Est Next Qtrly | 0 |
| EPS Est This Year | 0 |
| EPS Est Next Year | 0 |
| Book Value (p.s.) | 15.46 |
| Profit Margin | -50.3 % |
| Operating Margin | -14.3 % |
| Return on Assets (ttm) | -2.2 % |
| Return on Equity (ttm) | -71.8 % |
| Qtrly Rev. Growth | -21.8 % |
| Gross Profit (p.s.) | 0 |
| Sales Per Share | 39.47 |
| EBITDA (p.s.) | 3.05 |
| Qtrly Earnings Growth | 0 % |
| Operating Cash Flow | -1 (M) |
| Levered Free Cash Flow | 8 (M) |
| PE Ratio | -0.27 |
| PEG Ratio | 0 |
| Price to Book value | 0.29 |
| Price to Sales | 0.11 |
| Price to Cash Flow | -12.76 |
| Dividend | 0 |
| Forward Dividend | 0 |
| Dividend Yield | 0% |
| Dividend Pay Date | Invalid DateTime. |
| Ex-Dividend Date | Invalid DateTime. |