
| 5.9 -0.48 (-7.52%) | 08-24 16:00 | |||||||||||||
|
|
| Short term |   |
|||
| Mid term |  |
|||
| Targets | 6-month : | 8.32 | 1-year : | 9.72 |
| Resists | First : | 7.13 | Second : | 8.32 |
| Pivot price | 6.4 |
|||
| Supports | First : | 5.25 | Second : | 4.09 |
| MAs | MA(5) : | 6.12 |
MA(20) : | 6.21  |
| MA(100) : | 4.75 |
MA(250) : | 3.92 |
|
| MACD | MACD : | 0.1 |
Signal : | 0.2 |
| %K %D | K(14,3) : | 38 |
D(3) : | 54.3 |
| RSI | RSI(14): 48.5 |
|||
| 52-week | High : | 10.77 | Low : | 1.3 |
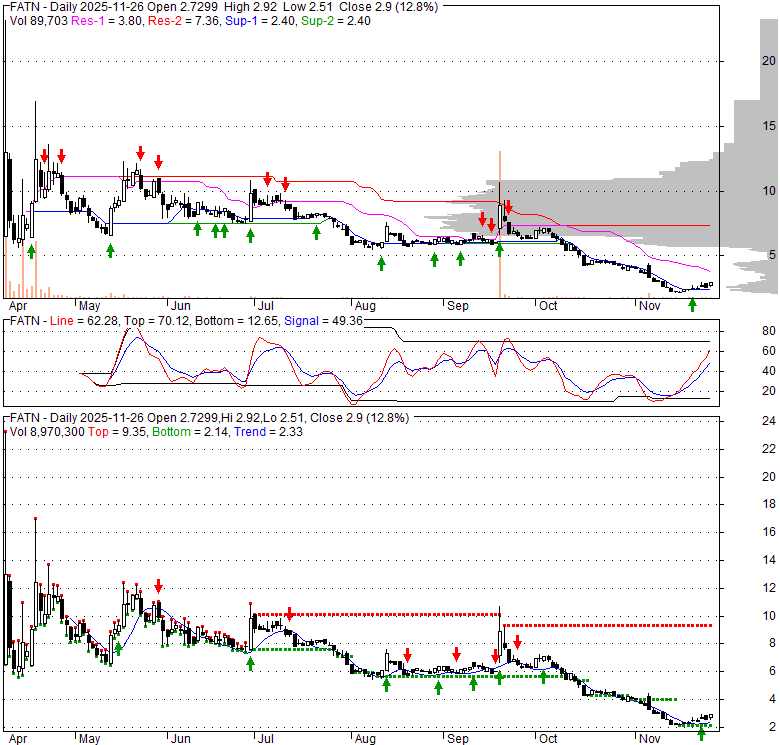
Price has closed below its short-term moving average. Short-term moving average is currently above mid-term; and above long-term moving average. From the relationship between price and moving averages: This stock is NEUTRAL in short-term; and BULLISH in mid-long term.[ FATN ] has closed above bottom band by 11.2%. Bollinger Bands are 44.2% narrower than normal. The narrow width of the bands suggests low volatility as compared to its normal range. The bands have been in this narrow range for 2 bars. This is a sign that the market may be about to initiate a new trend.
| If tomorrow: | Open lower | Open higher |
| High: | 6.42 - 6.46 | 6.46 - 6.48 |
| Low: | 5.77 - 5.81 | 5.81 - 5.83 |
| Close: | 5.84 - 5.9 | 5.9 - 5.94 |
FatPipe, Inc. develops application-aware, secure software-defined wide area network, secure access service edge, and network monitoring service (NMS) software solutions in the United States, India, and internationally. The company offers SD-WAN, a network architecture solution that allows enterprises to utilize software and virtualization technologies to enhance the performance, security, and manageability of their WANs that connect offices, data centers, cloud applications, and cloud storage; SASE that provides virtual network functions, which combine networking and network security services into a single cloud-delivered solution; and NMS, a EnterpriseView reporting system for network monitoring that provides a platform to monitor an end-user’s WAN and the performance of FatPipe devices under management. It also provides technical support services, professional, technology development, and training services. In addition, the company offers its solutions to enterprises, communication service providers, security service providers, government organizations, and other middle-market companies. The company sells its software solutions through a subscription-based model through a network of distributors, value-added resellers, internet service providers, and other third parties. FatPipe, Inc. was incorporated in 2010 and is headquartered in Salt Lake City, Utah.
Fri, 21 Aug 2026
FATN Stock Price, Quote & Chart - ChartMill
Tue, 18 Aug 2026
FatPipe's AI tool monitors server fans, light levels and network devices - Stock Titan
Thu, 30 Jul 2026
FatPipe Inc (NASDAQ: FATN) lifts revenue to $5.0M and remains profitable - Stock Titan
Thu, 30 Jul 2026
FatPipe (NASDAQ: FATN) posts 28% Q1 FY2027 revenue growth and strong margin - Stock Titan
Thu, 30 Jul 2026
FatPipe (FATN) Releases Q1 2027 Earnings: Revenue Growth and Higher Profitability | FATN Stock News - Quiver Quantitative
| Price to Book Value: P/BV, a ratio used to compare book value to its current market price, to gauge whether a stock is valued properly. |
Neutral |
| Price to Earnings: PE, the ratio for valuing a company that measures its current share price relative to its earnings per share (EPS). |
Neutral |
| Discounted cash flow: DCF, a valuation method used to estimate the value of an investment based on its expected future cash flows. |
Underperform |
| Return on Assets: ROA, indicates how profitable a company is in relation to its total assets, how efficiently uses assets to generate a profit. |
Outperform |
| Return on Equity: ROE, a measure of financial performance calculated by dividing net income by equity. a gauge of profitability and efficiency. |
Outperform |
| Debt to Equity: evaluate financial leverage, reflects the ability of equity to cover outstanding debts in the event of a business downturn. |
Neutral |
|
Exchange:
NASDAQ
|
|
|
Sector:
Technology
|
|
|
Industry:
Software - Infrastructure
|
|
| Shares Out | 14 (M) |
| Shares Float | 8 (M) |
| Held by Insiders | 54.5 (%) |
| Held by Institutions | 5.7 (%) |
| Shares Short | 73 (K) |
| Shares Short P.Month | 87 (K) |
| EPS | 0.38 |
| EPS Est Next Qtrly | 0 |
| EPS Est This Year | 0 |
| EPS Est Next Year | 0 |
| Book Value (p.s.) | 1.87 |
| Profit Margin | 26.7 % |
| Operating Margin | 17.9 % |
| Return on Assets (ttm) | 6.4 % |
| Return on Equity (ttm) | 23.2 % |
| Qtrly Rev. Growth | 27.7 % |
| Gross Profit (p.s.) | 1.3 |
| Sales Per Share | 1.43 |
| EBITDA (p.s.) | 0.26 |
| Qtrly Earnings Growth | 74 % |
| Operating Cash Flow | -1 (M) |
| Levered Free Cash Flow | 0 (M) |
| PE Ratio | 15.12 |
| PEG Ratio | 0 |
| Price to Book value | 3.13 |
| Price to Sales | 4.1 |
| Price to Cash Flow | -87.68 |
| Dividend | 0 |
| Forward Dividend | 0 |
| Dividend Yield | 0% |
| Dividend Pay Date | Invalid DateTime. |
| Ex-Dividend Date | Invalid DateTime. |

|

|
|

|
|
|
|
|
|