| 16.825 0 (0%) | 01-13 15:35 | |||||||||||||
|
|
| Short term | ||||
| Mid term | |
|||
| Targets | 6-month : | 19.65 |
1-year : | 22.95 |
| Resists | First : | 16.82 |
Second : | 19.65 |
| Pivot price | 16.72 |
|||
| Supports | First : | 16.56 |
Second : | 16.4 |
| MAs | MA(5) : | 16.82 | MA(20) : | 16.66 |
| MA(100) : | 17.58 |
MA(250) : | 18.81 |
|
| MACD | MACD : | -0.1 |
Signal : | -0.2 |
| %K %D | K(14,3) : | 98.7 |
D(3) : | 98.8 |
| RSI | RSI(14): 48.7 | |||
| 52-week | High : | 21.68 | Low : | 16.4 |
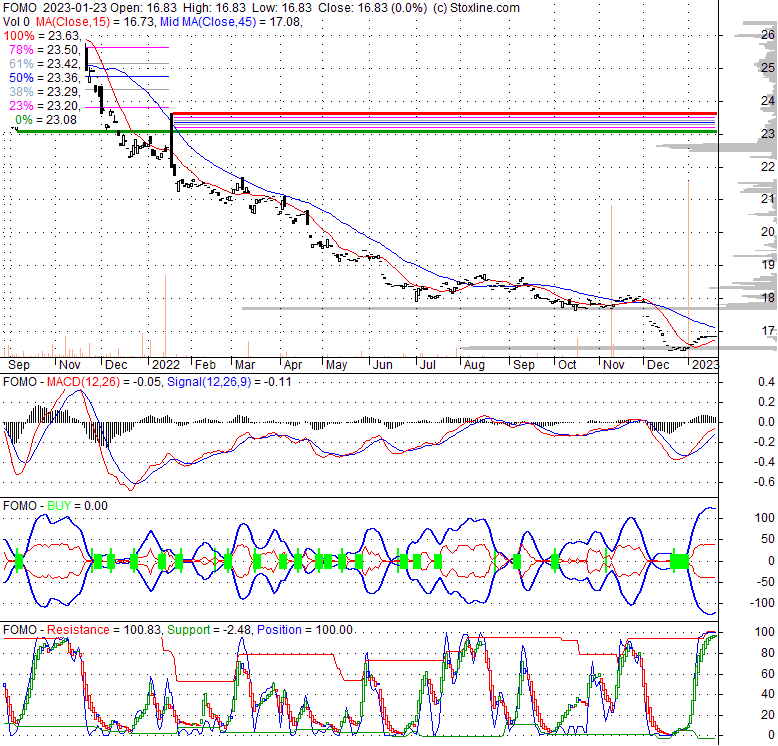
Price has closed below its short-term moving average. Short-term moving average is currently below mid-term; and below long-term moving average. From the relationship between price and moving averages: This stock is NEUTRAL in short-term; and BEARISH in mid-long term.[ FOMO ] has closed below upper band by 29.9%. Bollinger Bands are 22.8% narrower than normal. The current width of the bands does not suggest anything about the future direction or movement of prices.
| If tomorrow: | Open lower | Open higher |
| High: | 16.86 - 16.95 | 16.95 - 17.01 |
| Low: | 16.59 - 16.71 | 16.71 - 16.8 |
| Close: | 16.66 - 16.84 | 16.84 - 16.98 |
The fund is an actively managed exchange traded fund that will invest primarily in equity securities of U.S., foreign, and emerging market companies of any market capitalization and SPACs. It invests, on a short-term basis, in inverse and leveraged ETFs that seek to provide the inverse performance of stock indices, treasury bonds, and volatility ETFs. The fund will invest in fixed income ETFs that primarily invest in domestic and foreign fixed income securities of any credit rating maturity and duration.
Thu, 07 Mar 2024
MAGA, YODA and BRRR - The quest for catchy ETF tickers - Financial Times
Tue, 13 Feb 2024
Bitcoin ETF 'FOMO Rally' Could Send Price to All-Time High: Bernstein - Decrypt
| Price to Book Value: P/BV, a ratio used to compare book value to its current market price, to gauge whether a stock is valued properly. |
Neutral |
| Price to Earnings: PE, the ratio for valuing a company that measures its current share price relative to its earnings per share (EPS). |
Neutral |
| Discounted cash flow: DCF, a valuation method used to estimate the value of an investment based on its expected future cash flows. |
Neutral |
| Return on Assets: ROA, indicates how profitable a company is in relation to its total assets, how efficiently uses assets to generate a profit. |
Neutral |
| Return on Equity: ROE, a measure of financial performance calculated by dividing net income by equity. a gauge of profitability and efficiency. |
Neutral |
| Debt to Equity: evaluate financial leverage, reflects the ability of equity to cover outstanding debts in the event of a business downturn. |
Neutral |
|
Exchange:
ETF
|
|
|
Sector:
|
|
|
Industry:
|
|
| Shares Out | 0 (M) |
| Shares Float | 0 (M) |
| Held by Insiders | 0 (%) |
| Held by Institutions | 0 (%) |
| Shares Short | 0 (K) |
| Shares Short P.Month | 0 (K) |
| EPS | 0 |
| EPS Est Next Qtrly | 0 |
| EPS Est This Year | 0 |
| EPS Est Next Year | 0 |
| Book Value (p.s.) | 0 |
| Profit Margin | 0 % |
| Operating Margin | 0 % |
| Return on Assets (ttm) | 0 % |
| Return on Equity (ttm) | 0 % |
| Qtrly Rev. Growth | 0 % |
| Gross Profit (p.s.) | 0 |
| Sales Per Share | 0 |
| EBITDA (p.s.) | 0 |
| Qtrly Earnings Growth | 0 % |
| Operating Cash Flow | 0 (M) |
| Levered Free Cash Flow | 0 (M) |
| PE Ratio | 0 |
| PEG Ratio | 0 |
| Price to Book value | 0 |
| Price to Sales | 0 |
| Price to Cash Flow | 0 |
| Dividend | 0 |
| Forward Dividend | 0 |
| Dividend Yield | 0% |
| Dividend Pay Date | Invalid DateTime. |
| Ex-Dividend Date | Invalid DateTime. |

|

|
|

|
|
|
|
|
|