| 0 (0%) | 04-20 05:15 | |||||||||||||
|
|
| Short term | |
|||
| Mid term | ||||
| Targets | 6-month : | 119.99 |
1-year : | 125.46 |
| Resists | First : | 102.73 |
Second : | 107.41 |
| Pivot price | 101.05 |
|||
| Supports | First : | 95.15 |
Second : | 79.16 |
| MAs | MA(5) : | 97.33 |
MA(20) : | 102.32 |
| MA(100) : | 97.76 |
MA(250) : | 90.02 |
|
| MACD | MACD : | -1.6 |
Signal : | -0.6 |
| %K %D | K(14,3) : | 3.3 |
D(3) : | 3.9 |
| RSI | RSI(14): 30.1 |
|||
| 52-week | High : | 107.41 | Low : | 75.73 |
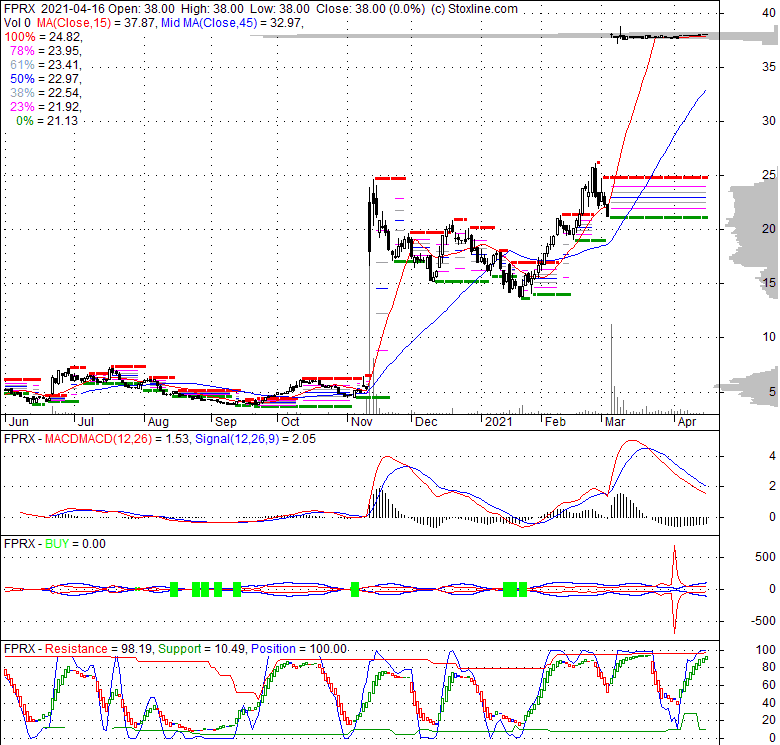
Price has closed below its short-term moving average. Short-term moving average is currently below mid-term; and below long-term moving average. From the relationship between price and moving averages: This stock is BEARISH in short-term; and NEUTRAL in mid-long term.[ FPX ] has closed above bottom band by 2.9%. Bollinger Bands are 49.9% wider than normal. The large width of the bands suggest high volatility as compared to its normal range. The bands have been in this wide range for 1 days. This is a sign that the current trend might continue.
| If tomorrow: | Open lower | Open higher |
| High: | 97.48 - 98.27 | 98.27 - 98.8 |
| Low: | 93.51 - 94.38 | 94.38 - 94.97 |
| Close: | 94.55 - 95.91 | 95.91 - 96.82 |
Tue, 20 Apr 2021
Amgen Completes The Acquisition Of Five Prime Therapeutics - Nasdaq
Fri, 05 Mar 2021
Five Prime Therapeutics (FPRX) Stock Jumps 78.7%: Will It Continue to Soar? - Yahoo Finance
Thu, 04 Mar 2021
Amgen To Acquire Five Prime Therapeutics For $1.9 Billion in Cash - PR Newswire
Wed, 25 Nov 2020
How a longtime Peninsula biotech company's stomach cancer drug moved closer to the finish line - San Francisco ... - The Business Journals
Mon, 10 Aug 2020
What Type Of Shareholders Own The Most Number of Five Prime Therapeutics, Inc. (NASDAQ:FPRX) Shares? - Yahoo Movies UK
Thu, 10 Oct 2019
Five Prime Announces Restructuring - Business Wire
| Price to Book Value: P/BV, a ratio used to compare book value to its current market price, to gauge whether a stock is valued properly. |
Outperform |
| Price to Earnings: PE, the ratio for valuing a company that measures its current share price relative to its earnings per share (EPS). |
Underperform |
| Discounted cash flow: DCF, a valuation method used to estimate the value of an investment based on its expected future cash flows. |
Outperform |
| Return on Assets: ROA, indicates how profitable a company is in relation to its total assets, how efficiently uses assets to generate a profit. |
Neutral |
| Return on Equity: ROE, a measure of financial performance calculated by dividing net income by equity. a gauge of profitability and efficiency. |
Neutral |
| Debt to Equity: evaluate financial leverage, reflects the ability of equity to cover outstanding debts in the event of a business downturn. |
Neutral |
|
Exchange:
|
|
|
Sector:
|
|
|
Industry:
|
|
| Shares Out | 0 (M) |
| Shares Float | 0 (M) |
| Held by Insiders | 0 (%) |
| Held by Institutions | 0 (%) |
| Shares Short | 0 (K) |
| Shares Short P.Month | 0 (K) |
| EPS | 0 |
| EPS Est Next Qtrly | 0 |
| EPS Est This Year | 0 |
| EPS Est Next Year | 0 |
| Book Value (p.s.) | 0 |
| Profit Margin | 0 % |
| Operating Margin | 0 % |
| Return on Assets (ttm) | 0 % |
| Return on Equity (ttm) | 0 % |
| Qtrly Rev. Growth | 0 % |
| Gross Profit (p.s.) | 0 |
| Sales Per Share | 0 |
| EBITDA (p.s.) | 0 |
| Qtrly Earnings Growth | 0 % |
| Operating Cash Flow | 0 (M) |
| Levered Free Cash Flow | 0 (M) |
| PE Ratio | 0 |
| PEG Ratio | 0 |
| Price to Book value | 0 |
| Price to Sales | 0 |
| Price to Cash Flow | 0 |
| Dividend | 0 |
| Forward Dividend | 0 |
| Dividend Yield | 0% |
| Dividend Pay Date | Invalid DateTime. |
| Ex-Dividend Date | Invalid DateTime. |

|

|
|

|
|
|
|
|
|