| 0 (0%) | 04-25 22:19 | |||||||||||||
|
|
| Short term | ||||
| Mid term | |
|||
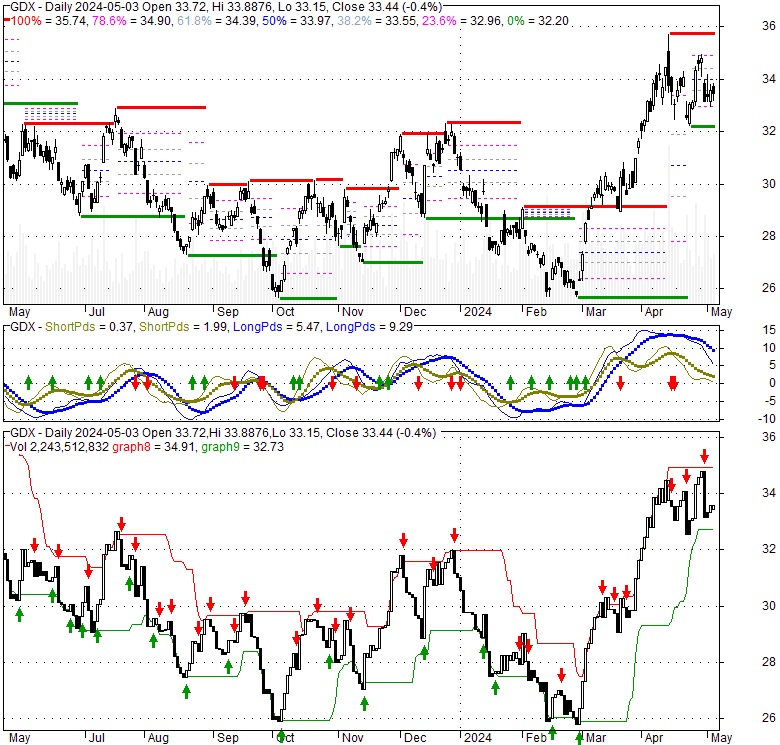
| Targets | 6-month : | 41.74 | 1-year : | 48.75 |
| Resists | First : | 35.74 | Second : | 41.74 |
| Pivot price | 33.63 |
|||
| Supports | First : | 31.93 |
Second : | 29.59 |
| MAs | MA(5) : | 33.41 |
MA(20) : | 33.32 |
| MA(100) : | 29.84 |
MA(250) : | 29.89 |
|
| MACD | MACD : | 0.8 |
Signal : | 1 |
| %K %D | K(14,3) : | 36.7 |
D(3) : | 30.3 |
| RSI | RSI(14): 62.6 |
|||
| 52-week | High : | 36.25 | Low : | 25.62 |
Price has closed above its short-term moving average. Short-term moving average is currently above mid-term; and above long-term moving average. From the relationship between price and moving averages: This stock is BULLISH in short-term; and BULLISH in mid-long term.[ GDX ] has closed below upper band by 15.8%. Bollinger Bands are 43.5% narrower than normal. The narrow width of the bands suggests low volatility as compared to its normal range. The bands have been in this narrow range for 2 bars. This is a sign that the market may be about to initiate a new trend.
| If tomorrow: | Open lower | Open higher |
| High: | 34.54 - 34.67 | 34.67 - 34.81 |
| Low: | 32.61 - 32.76 | 32.76 - 32.92 |
| Close: | 34.07 - 34.32 | 34.32 - 34.56 |
Thu, 25 Apr 2024
Genomic Health Inc (GHDX) President and CEO Kimberly J Popovits Sold $3.7 million of Shares - AOL
Mon, 22 Apr 2024
Axovant Sciences (AXON) Soars: Stock Adds 5.5% in Session - Yahoo Canada Shine On
Wed, 02 Aug 2023
The number of deaths attributable to second hand smoke exposure has increased between 1990 and 2019 - News-Medical.Net
Wed, 15 Mar 2023
Jeremy Ney MPA 2021: Making inequality visible - Harvard Kennedy School
Wed, 31 Aug 2022
Interactive data visuals - Institute for Health Metrics and Evaluation |
Mon, 27 Jun 2022
The Socio-economic Impact of Untreated Mental Illness - PwC
| Price to Book Value: P/BV, a ratio used to compare book value to its current market price, to gauge whether a stock is valued properly. |
Outperform |
| Price to Earnings: PE, the ratio for valuing a company that measures its current share price relative to its earnings per share (EPS). |
Outperform |
| Discounted cash flow: DCF, a valuation method used to estimate the value of an investment based on its expected future cash flows. |
Outperform |
| Return on Assets: ROA, indicates how profitable a company is in relation to its total assets, how efficiently uses assets to generate a profit. |
Neutral |
| Return on Equity: ROE, a measure of financial performance calculated by dividing net income by equity. a gauge of profitability and efficiency. |
Neutral |
| Debt to Equity: evaluate financial leverage, reflects the ability of equity to cover outstanding debts in the event of a business downturn. |
Neutral |
|
Exchange:
|
|
|
Sector:
|
|
|
Industry:
|
|
| Shares Out | 0 (M) |
| Shares Float | 0 (M) |
| Held by Insiders | 0 (%) |
| Held by Institutions | 0 (%) |
| Shares Short | 0 (K) |
| Shares Short P.Month | 0 (K) |
| EPS | 0 |
| EPS Est Next Qtrly | 0 |
| EPS Est This Year | 0 |
| EPS Est Next Year | 0 |
| Book Value (p.s.) | 0 |
| Profit Margin | 0 % |
| Operating Margin | 0 % |
| Return on Assets (ttm) | 0 % |
| Return on Equity (ttm) | 0 % |
| Qtrly Rev. Growth | 0 % |
| Gross Profit (p.s.) | 0 |
| Sales Per Share | 0 |
| EBITDA (p.s.) | 0 |
| Qtrly Earnings Growth | 0 % |
| Operating Cash Flow | 0 (M) |
| Levered Free Cash Flow | 0 (M) |
| PE Ratio | 0 |
| PEG Ratio | 0 |
| Price to Book value | 0 |
| Price to Sales | 0 |
| Price to Cash Flow | 0 |
| Dividend | 0 |
| Forward Dividend | 0 |
| Dividend Yield | 0% |
| Dividend Pay Date | Invalid DateTime. |
| Ex-Dividend Date | Invalid DateTime. |

|

|
|

|
|
|
|
|
|