
| 27.83 -0.06 (-0.22%) | 09-14 16:00 | |||||||||||||
|
|
| Short term |   |
|||
| Mid term |  |
|||
| Targets | 6-month : | 37.88 |
1-year : | 41.88 |
| Resists | First : | 32.43 |
Second : | 35.86 |
| Pivot price | 30.27 |
|||
| Supports | First : | 26.89 | Second : | 22.38 |
| MAs | MA(5) : | 27.71  |
MA(20) : | 31.13 |
| MA(100) : | 32.85 |
MA(250) : | 30.29 |
|
| MACD | MACD : | -1.9 |
Signal : | -1.6 |
| %K %D | K(14,3) : | 12.4 |
D(3) : | 11 |
| RSI | RSI(14): 24.2 |
|||
| 52-week | High : | 37.54 | Low : | 24.44 |
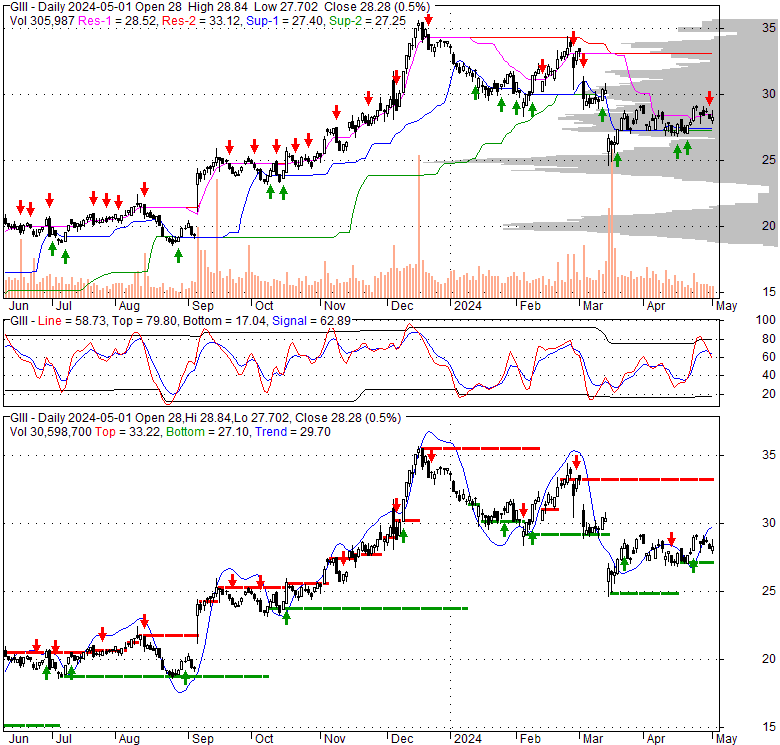
Price has closed above its short-term moving average. Short-term moving average is currently below mid-term; and below long-term moving average. From the relationship between price and moving averages: This stock is NEUTRAL in short-term; and NEUTRAL in mid-long term.[ GIII ] has closed above bottom band by 27.7%. Bollinger Bands are 164.9% wider than normal. The large width of the bands suggest high volatility as compared to its normal range. The bands have been in this wide range for 7 days. This is a sign that the current trend might continue.
| If tomorrow: | Open lower | Open higher |
| High: | 28.16 - 28.32 | 28.32 - 28.46 |
| Low: | 27.02 - 27.2 | 27.2 - 27.35 |
| Close: | 27.58 - 27.86 | 27.86 - 28.11 |
G-III Apparel Group, Ltd. designs, sources, and markets women’s and men’s apparel in the United States and internationally. It operates through two segments, Wholesale Operations and Retail Operations. The company offers outerwear, dresses, sportswear, swimwear, women’s suits, performance wear, suit separates, athleisure, jeans, handbags, footwear, accessories, small leather goods, cold weather accessories, and luggage. It markets apparel and other products under the its owned brands, including Andrew Marc, DKNY, Donna Karan, Eliza J, G.H. Bass, G-III for Her, G-III Sports by Carl Banks, Jessica Howard, Karl Lagerfeld, Karl Lagerfeld Paris, Marc New York, Sonia Rykiel, Vilebrequin, and Wilsons Leather; and under its licensed brands, such as BCBG, Calvin Klein, Champion, Cole Haan, Converse, Dockers, French Connection, Halston, Kenneth Cole, Kensie, Levi’s, Margaritaville, Nautica, Tommy Hilfiger, and Vince Camuto. The company also engages in licensed team sports business that has partnerships with the National Football League, National Basketball Association, Major League Baseball, and National Hockey League, as well as U.S. colleges and universities. It distributes its products through retailers, digital channels, and online retail partners. G-III Apparel Group, Ltd. was founded in 1956 and is based in New York, New York.
Mon, 14 Sep 2026
G-III Apparel Group, LTD. $GIII Shares Bought by Engineers Gate Manager LP - MarketBeat
Sun, 13 Sep 2026
Is G-III Apparel Group (GIII) A Bargain Following Raised Full Year Guidance? - simplywall.st
Sun, 13 Sep 2026
G-III Apparel Group, LTD. (NASDAQ:GIII) Receives Consensus Rating of "Moderate Buy" from Brokerages - MarketBeat
Fri, 11 Sep 2026
G-III Apparel Group (NASDAQ:GIII) Could Be A Buy For Its Upcoming Dividend - simplywall.st
Fri, 11 Sep 2026
Precision Trading with G-iii Apparel Group Ltd. (GIII) Risk Zones - Stock Traders Daily
Sat, 05 Sep 2026
G III Apparel Group (GIII) Stock Looks Overvalued As Shares Fell 24% - Yahoo Finance
| Price to Book Value: P/BV, a ratio used to compare book value to its current market price, to gauge whether a stock is valued properly. |
Outperform |
| Price to Earnings: PE, the ratio for valuing a company that measures its current share price relative to its earnings per share (EPS). |
Neutral |
| Discounted cash flow: DCF, a valuation method used to estimate the value of an investment based on its expected future cash flows. |
Outperform |
| Return on Assets: ROA, indicates how profitable a company is in relation to its total assets, how efficiently uses assets to generate a profit. |
Outperform |
| Return on Equity: ROE, a measure of financial performance calculated by dividing net income by equity. a gauge of profitability and efficiency. |
Neutral |
| Debt to Equity: evaluate financial leverage, reflects the ability of equity to cover outstanding debts in the event of a business downturn. |
Outperform |
|
Exchange:
NASDAQ
|
|
|
Sector:
Consumer Cyclical
|
|
|
Industry:
Apparel - Manufacturers
|
|
| Shares Out | 42 (M) |
| Shares Float | 36 (M) |
| Held by Insiders | 16.1 (%) |
| Held by Institutions | 107.5 (%) |
| Shares Short | 7,590 (K) |
| Shares Short P.Month | 7,450 (K) |
| EPS | 3.03 |
| EPS Est Next Qtrly | 0 |
| EPS Est This Year | 0 |
| EPS Est Next Year | 0 |
| Book Value (p.s.) | 43.24 |
| Profit Margin | 4.7 % |
| Operating Margin | 1.9 % |
| Return on Assets (ttm) | 0 % |
| Return on Equity (ttm) | 0 % |
| Qtrly Rev. Growth | -9.7 % |
| Gross Profit (p.s.) | 27.49 |
| Sales Per Share | 67.55 |
| EBITDA (p.s.) | 3.66 |
| Qtrly Earnings Growth | 84 % |
| Operating Cash Flow | 0 (M) |
| Levered Free Cash Flow | 0 (M) |
| PE Ratio | 9.15 |
| PEG Ratio | 1.2 |
| Price to Book value | 0.64 |
| Price to Sales | 0.41 |
| Price to Cash Flow | 0 |
| Dividend | 0.1 |
| Forward Dividend | 0 |
| Dividend Yield | 0.3% |
| Dividend Pay Date | Invalid DateTime. |
| Ex-Dividend Date | Invalid DateTime. |

|

|
|

|
|
|
|
|
|