| 1.32 0.06 (4.76%) | 07-26 16:00 | |||||||||||||
|
|
| Short term | |
|||
| Mid term | |
|||
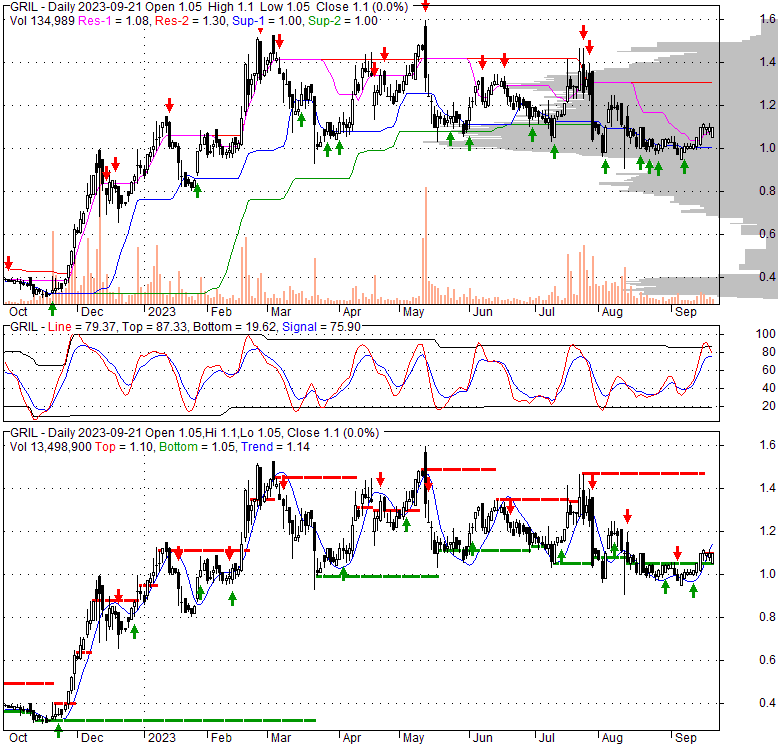
| Targets | 6-month : | 1.3 | 1-year : | 1.52 |
| Resists | First : | 1.12 | Second : | 1.3 |
| Pivot price | 1.04 |
|||
| Supports | First : | 1.01 | Second : | 0.94 |
| MAs | MA(5) : | 1.1 |
MA(20) : | 1.03 |
| MA(100) : | 1.16 |
MA(250) : | 0.97 |
|
| MACD | MACD : | 0 |
Signal : | -0.1 |
| %K %D | K(14,3) : | 88.2 |
D(3) : | 90.8 |
| RSI | RSI(14): 56.1 | |||
| 52-week | High : | 1.59 | Low : | 0.3 |
Price has closed below its short-term moving average. Short-term moving average is currently above mid-term; and below long-term moving average. From the relationship between price and moving averages: This stock is NEUTRAL in short-term; and NEUTRAL in mid-long term.[ GRIL ] has closed below upper band by 18.6%. Bollinger Bands are 33.6% narrower than normal. The current width of the bands does not suggest anything about the future direction or movement of prices.
| If tomorrow: | Open lower | Open higher |
| High: | 1.1 - 1.11 | 1.11 - 1.11 |
| Low: | 1.04 - 1.04 | 1.04 - 1.05 |
| Close: | 1.09 - 1.1 | 1.1 - 1.11 |
Muscle Maker, Inc. owns, operates, and franchises Muscle Maker Grill, SuperFit Foods meal prep, and Pokemoto Hawaiian Poke restaurants. The company operates a fast-casual restaurant that specializes in preparing protein-based meals featuring chicken, seafood, pasta, hamburgers, wraps, and flat breads, as well as entrée salads and sides, protein shakes, and fruit smoothies. It also operates under the Meal Plan AF, Muscle Maker Burger Bar, Bowls Deep, Burger Joe's, Wrap It Up, Salad Vibes, Mr. T's House of Boba, and Gourmet Sandwich brand names. In addition, the company offers Muscle Maker meal prep/plans to consumers through direct- to-consumer using musclemakerprep.com. As of December 31, 2021, it operated forty-two restaurants comprised of twenty-two company-operated restaurants and twenty franchised restaurants located in California, Florida, Georgia, Maryland, Massachusetts, New Jersey, New York, Connecticut, North Carolina, Oklahoma, Pennsylvania, Texas, Virginia, Washington, and Rhode Island, as well as in Kuwait. The company was incorporated in 2014 and is based in League City, Texas.
Wed, 26 Jul 2023
Restaurant Group Passes Half Billion Changes Name - Streetwise Reports
Wed, 26 Jul 2023
Muscle Maker Inc. (Nasdaq: GRIL) Announces Name Change and Rebranding to Sadot Group Inc. (Nasdaq: SDOT) - Yahoo Finance
Thu, 22 Jun 2023
Muscle Maker Inc Subsidiary, Sadot LLC, Announces Strategic Agreement Expanding Commodity Trade Routes into ... - Yahoo Finance
Thu, 01 Jun 2023
Muscle Maker, Inc. Reports Top Line Revenue Over $58.9 Million for April 2023 - Yahoo Finance
Wed, 10 May 2023
Muscle Maker Inc. Reports First Quarter 2023 Results - Yahoo Finance
Thu, 19 Jan 2023
Muscle Maker, Inc. (GRIL) Announces First Combo Restaurant - Adding Pokemoto to Existing Muscle Maker Grill ... - GlobeNewswire
| Price to Book Value: P/BV, a ratio used to compare book value to its current market price, to gauge whether a stock is valued properly. |
Outperform |
| Price to Earnings: PE, the ratio for valuing a company that measures its current share price relative to its earnings per share (EPS). |
Underperform |
| Discounted cash flow: DCF, a valuation method used to estimate the value of an investment based on its expected future cash flows. |
Outperform |
| Return on Assets: ROA, indicates how profitable a company is in relation to its total assets, how efficiently uses assets to generate a profit. |
Underperform |
| Return on Equity: ROE, a measure of financial performance calculated by dividing net income by equity. a gauge of profitability and efficiency. |
Underperform |
| Debt to Equity: evaluate financial leverage, reflects the ability of equity to cover outstanding debts in the event of a business downturn. |
Underperform |

|
Exchange:
NASDAQ
|
|
|
Sector:
Consumer Cyclical
|
|
|
Industry:
Restaurants
|
|
| Shares Out | 0 (M) |
| Shares Float | 0 (M) |
| Held by Insiders | 0 (%) |
| Held by Institutions | 0 (%) |
| Shares Short | 0 (K) |
| Shares Short P.Month | 0 (K) |
| EPS | 0 |
| EPS Est Next Qtrly | 0 |
| EPS Est This Year | 0 |
| EPS Est Next Year | 0 |
| Book Value (p.s.) | 0 |
| Profit Margin | 0 % |
| Operating Margin | 0 % |
| Return on Assets (ttm) | 0 % |
| Return on Equity (ttm) | 0 % |
| Qtrly Rev. Growth | 0 % |
| Gross Profit (p.s.) | 174.23 |
| Sales Per Share | 3.3491e+008 |
| EBITDA (p.s.) | 3.88288e+006 |
| Qtrly Earnings Growth | 0 % |
| Operating Cash Flow | 0 (M) |
| Levered Free Cash Flow | 0 (M) |
| PE Ratio | 0 |
| PEG Ratio | 0 |
| Price to Book value | 0 |
| Price to Sales | 0 |
| Price to Cash Flow | 0 |
| Dividend | 0 |
| Forward Dividend | 0 |
| Dividend Yield | 0% |
| Dividend Pay Date | Invalid DateTime. |
| Ex-Dividend Date | Invalid DateTime. |