| 3.18 -0.09 (-2.75%) | 03-21 16:00 | |||||||||||||
|
|
| Short term | ||||
| Mid term | ||||
| Targets | 6-month : | 34.82 |
1-year : | 40.68 |
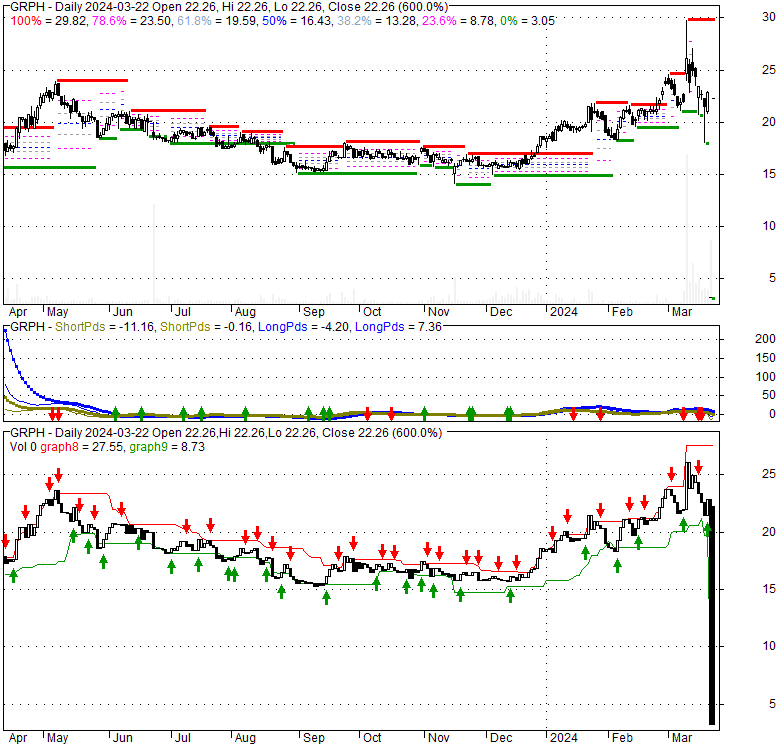
| Resists | First : | 29.81 |
Second : | 34.82 |
| Pivot price | 21.75 |
|||
| Supports | First : | 13.27 |
Second : | 3.04 |
| MAs | MA(5) : | 18.48 |
MA(20) : | 22 |
| MA(100) : | 18.82 |
MA(250) : | 18.55 |
|
| MACD | MACD : | -0.8 |
Signal : | 0.2 |
| %K %D | K(14,3) : | 37.8 |
D(3) : | 30.8 |
| RSI | RSI(14): 51.3 |
|||
| 52-week | High : | 29.81 | Low : | 3.04 |
Price has closed above its short-term moving average. Short-term moving average is currently below mid-term; and below long-term moving average. From the relationship between price and moving averages: This stock is NEUTRAL in short-term; and NEUTRAL in mid-long term.[ GRPH ] has closed below upper band by 47.5%. Bollinger Bands are 548.8% wider than normal. The large width of the bands suggest high volatility as compared to its normal range. The bands have been in this wide range for 16 days. This is a sign that the current trend might continue.
| If tomorrow: | Open lower | Open higher |
| High: | 22.28 - 22.44 | 22.44 - 22.56 |
| Low: | 21.96 - 22.13 | 22.13 - 22.26 |
| Close: | 22.04 - 22.3 | 22.3 - 22.5 |
Graphite Bio, Inc., a clinical-stage gene editing company, engages in developing therapies for serious and life-threatening diseases in the United States. It offers GPH101, a gene-edited autologous hematopoietic stem cell product candidate to directly correct the mutation that causes sickle cell disease and restore normal adult hemoglobin expression; GPH201 for the treatment of X-linked severe combined immunodeficiency syndrome; and GPH301, a product candidate for the treatment of Gaucher disease, a genetic disorder that results in a deficiency in the glucocerebrosidase enzyme. The company was formerly known as Integral Medicines, Inc., and changed its name to Graphite Bio, Inc. in August 2020. Graphite Bio, Inc. was incorporated in 2017 and is headquartered in South San Francisco, California.
Tue, 19 Mar 2024
Graphite Bio Approves Merger, Name Change, and Stock Split - TipRanks.com - TipRanks
Fri, 15 Mar 2024
Graphite Bio, Inc. Plans Dividend of $1.03 (NASDAQ:GRPH) - MarketBeat
Thu, 14 Mar 2024
Premarket Mover: Graphite Bio Inc (GRPH) Up 2.81% - InvestorsObserver
Tue, 12 Mar 2024
What is the Market's View on Graphite Bio Inc (GRPH) Stock's Price and Volume Trends Tuesday? - InvestorsObserver
Mon, 11 Mar 2024
Graphite Bio Inc (GRPH) Up 17.83% in Premarket Trading - InvestorsObserver
Fri, 08 Mar 2024
Graphite Bio Announces Special Dividend Amid Lenz Merger - TipRanks.com - TipRanks
| Price to Book Value: P/BV, a ratio used to compare book value to its current market price, to gauge whether a stock is valued properly. |
Outperform |
| Price to Earnings: PE, the ratio for valuing a company that measures its current share price relative to its earnings per share (EPS). |
Underperform |
| Discounted cash flow: DCF, a valuation method used to estimate the value of an investment based on its expected future cash flows. |
Outperform |
| Return on Assets: ROA, indicates how profitable a company is in relation to its total assets, how efficiently uses assets to generate a profit. |
Underperform |
| Return on Equity: ROE, a measure of financial performance calculated by dividing net income by equity. a gauge of profitability and efficiency. |
Underperform |
| Debt to Equity: evaluate financial leverage, reflects the ability of equity to cover outstanding debts in the event of a business downturn. |
Underperform |
|
Exchange:
NASDAQ
|
|
|
Sector:
Healthcare
|
|
|
Industry:
Biotechnology
|
|
| Shares Out | 58 (M) |
| Shares Float | 2 (M) |
| Held by Insiders | 0 (%) |
| Held by Institutions | 0 (%) |
| Shares Short | 101 (K) |
| Shares Short P.Month | 115 (K) |
| EPS | -15.33 |
| EPS Est Next Qtrly | 0 |
| EPS Est This Year | 0 |
| EPS Est Next Year | 0 |
| Book Value (p.s.) | 22.14 |
| Profit Margin | 0 % |
| Operating Margin | 0 % |
| Return on Assets (ttm) | -18 % |
| Return on Equity (ttm) | -52 % |
| Qtrly Rev. Growth | 0 % |
| Gross Profit (p.s.) | 0 |
| Sales Per Share | 0 |
| EBITDA (p.s.) | -1.22 |
| Qtrly Earnings Growth | 0 % |
| Operating Cash Flow | -90 (M) |
| Levered Free Cash Flow | -45 (M) |
| PE Ratio | -1.46 |
| PEG Ratio | -0.4 |
| Price to Book value | 1 |
| Price to Sales | 0 |
| Price to Cash Flow | -14.41 |
| Dividend | 1.02 |
| Forward Dividend | 0 |
| Dividend Yield | 4.6% |
| Dividend Pay Date | Invalid DateTime. |
| Ex-Dividend Date | Invalid DateTime. |

|

|
|

|
|
|
|
|
|