
| 21.1975 0 (0%) | 10-23 09:46 | |||||||||||||
|
|
| Short term |   |
|||
| Mid term | |
|||
| Targets | 6-month : | 25.73 |
1-year : | 26.33 |
| Resists | First : | 22.03 |
Second : | 22.54 |
| Pivot price | 21.61 |
|||
| Supports | First : | 21.19 |
Second : | 17.63 |
| MAs | MA(5) : | 21.51 |
MA(20) : | 21.69 |
| MA(100) : | 19.44  |
MA(250) : | 21.04 |
|
| MACD | MACD : | 0 |
Signal : | 0.1 |
| %K %D | K(14,3) : | 42.2 | D(3) : | 35.2 |
| RSI | RSI(14): 45.9 |
|||
| 52-week | High : | 29.22 | Low : | 17.19 |
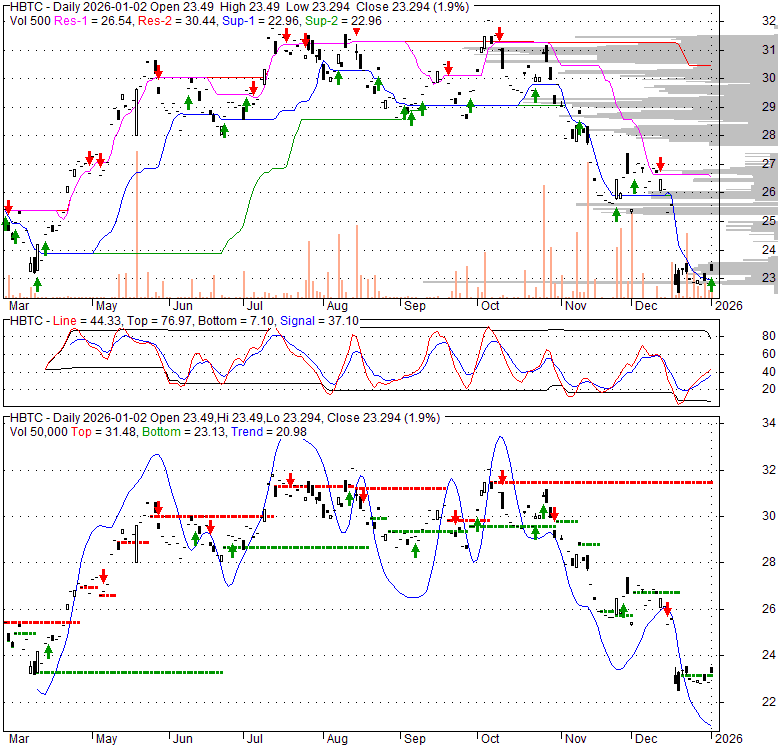
Price has closed below its short-term moving average. Short-term moving average is currently above mid-term; and above long-term moving average. From the relationship between price and moving averages: This stock is NEUTRAL in short-term; and BULLISH in mid-long term.[ HBTC ] has closed above bottom band by 15.7%. Bollinger Bands are 45.1% narrower than normal. The narrow width of the bands suggests low volatility as compared to its normal range. The bands have been in this narrow range for 11 bars. This is a sign that the market may be about to initiate a new trend.
| If tomorrow: | Open lower | Open higher |
| High: | 21.97 - 22.1 | 22.1 - 22.23 |
| Low: | 20.85 - 20.99 | 20.99 - 21.14 |
| Close: | 20.94 - 21.18 | 21.18 - 21.43 |
HBTC invests in Bitcoin-related securities with an options overlay to reduce downside risk. The fund does not directly invest in Bitcoin but invests in standardized, cash-settled BTC futures traded on the CME. The actively managed fund invests in options to create synthetic long exposure, allowing it to participate in price changes of the underlying securities. This involves purchasing a put below the current BTC price and selling a call spread above market price, offsetting costs without capping the upside potential. This limits participation in potential gains when the price of BTC goes up. The fund writes call options with 1- to 6-month terms and strike prices equal to the price at the time of purchase. HBTC typically invests in front-month contracts, rolling to the next closest expiration date. The fund invests in futures through a wholly owned Cayman Islands subsidiary. HBTC may also pursue covered calls on BTC futures contracts and similar ETFs. Prior to January 21, 2026, the fund traded under the name Fortuna Hedged Bitcoin Fund.
Wed, 12 Nov 2025
68 Bitcoin ETFs and Their Fees, Promotions and Holdings - NerdWallet
Wed, 23 Jul 2025
Dallas-Based Fortuna Funds Launches Hedged Bitcoin ETF on Chicago Board Options Exchange - Dallas Innovates
Thu, 27 Mar 2025
US ETF launches from 20th to 27th March, 2025 - ETF Express
Thu, 20 Mar 2025
New ETF From Fortuna Funds Offers Hedged Bitcoin Strategy - ETF Database
| Price to Book Value: P/BV, a ratio used to compare book value to its current market price, to gauge whether a stock is valued properly. |
Neutral |
| Price to Earnings: PE, the ratio for valuing a company that measures its current share price relative to its earnings per share (EPS). |
Neutral |
| Discounted cash flow: DCF, a valuation method used to estimate the value of an investment based on its expected future cash flows. |
Neutral |
| Return on Assets: ROA, indicates how profitable a company is in relation to its total assets, how efficiently uses assets to generate a profit. |
Neutral |
| Return on Equity: ROE, a measure of financial performance calculated by dividing net income by equity. a gauge of profitability and efficiency. |
Neutral |
| Debt to Equity: evaluate financial leverage, reflects the ability of equity to cover outstanding debts in the event of a business downturn. |
Neutral |
|
Exchange:
CBOE
|
|
|
Sector:
Financial Services
|
|
|
Industry:
Asset Management
|
|
| Shares Out | 0 (M) |
| Shares Float | 0 (M) |
| Held by Insiders | 0 (%) |
| Held by Institutions | 0 (%) |
| Shares Short | 0 (K) |
| Shares Short P.Month | 0 (K) |
| EPS | 0 |
| EPS Est Next Qtrly | 0 |
| EPS Est This Year | 0 |
| EPS Est Next Year | 0 |
| Book Value (p.s.) | 0 |
| Profit Margin | 0 % |
| Operating Margin | 0 % |
| Return on Assets (ttm) | 0 % |
| Return on Equity (ttm) | 0 % |
| Qtrly Rev. Growth | 0 % |
| Gross Profit (p.s.) | 0 |
| Sales Per Share | 0 |
| EBITDA (p.s.) | 0 |
| Qtrly Earnings Growth | 0 % |
| Operating Cash Flow | 0 (M) |
| Levered Free Cash Flow | 0 (M) |
| PE Ratio | 0 |
| PEG Ratio | 0 |
| Price to Book value | 0 |
| Price to Sales | 0 |
| Price to Cash Flow | 0 |
| Dividend | 0 |
| Forward Dividend | 0 |
| Dividend Yield | 0% |
| Dividend Pay Date | Invalid DateTime. |
| Ex-Dividend Date | Invalid DateTime. |

|

|

|

|
|
|
|
|
|