| 0 (0%) | 04-26 14:00 | |||||||||||||
|
|
| Short term | ||||
| Mid term | ||||
| Targets | 6-month : | 128.86 | 1-year : | 150.51 |
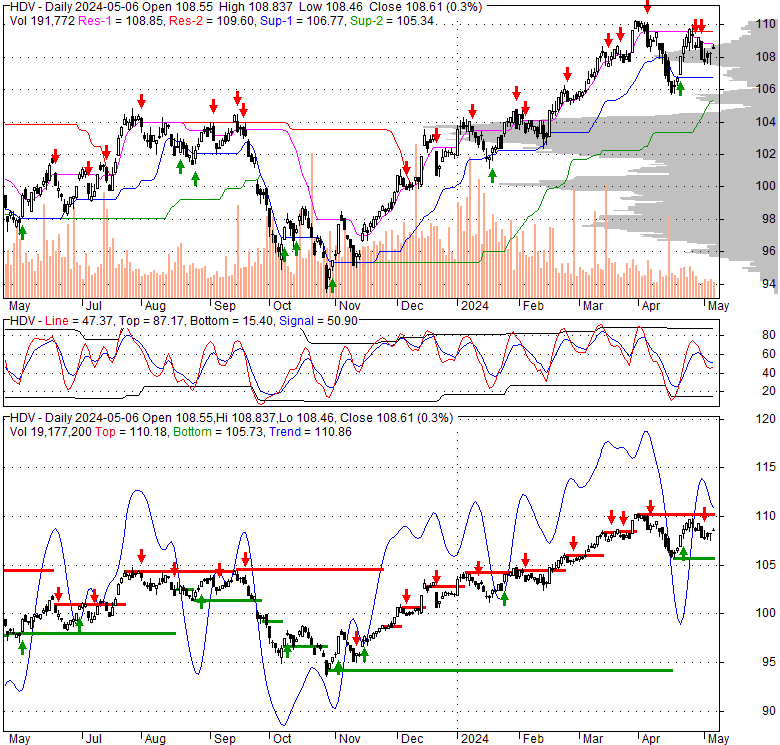
| Resists | First : | 110.33 | Second : | 128.86 |
| Pivot price | 108.07 |
|||
| Supports | First : | 107.43 | Second : | 105.65 |
| MAs | MA(5) : | 109.11 |
MA(20) : | 108.42 |
| MA(100) : | 105.07 |
MA(250) : | 102.02 |
|
| MACD | MACD : | 0.3 |
Signal : | 0.2 |
| %K %D | K(14,3) : | 81.8 |
D(3) : | 81.2 |
| RSI | RSI(14): 53.6 |
|||
| 52-week | High : | 110.33 | Low : | 93.45 |
Price has closed below its short-term moving average. Short-term moving average is currently above mid-term; and above long-term moving average. From the relationship between price and moving averages: This stock is NEUTRAL in short-term; and BULLISH in mid-long term.[ HDV ] has closed below upper band by 38.6%. Bollinger Bands are 33.8% wider than normal. The current width of the bands does not suggest anything about the future direction or movement of prices.
| If tomorrow: | Open lower | Open higher |
| High: | 109.99 - 110.54 | 110.54 - 110.9 |
| Low: | 107.11 - 107.86 | 107.86 - 108.33 |
| Close: | 108.25 - 109.38 | 109.38 - 110.1 |
Mon, 23 Oct 2023
Humm Embrace the Clarity of Solitude Within “Danced Alone (who I am when I’m in love)” - Atwood Magazine
Mon, 14 Aug 2023
Powder Coating 4.0: Smarter, Faster, More Efficient and Connected - Products Finishing
Thu, 16 Feb 2023
Are multi-factor ETFs the hot ticket item? - ETF Stream
Tue, 02 Aug 2022
Low volatility and high dividend ETFs shoot the lights out so far in 2022 - ETF Stream
Tue, 12 Nov 2019
Spooler's HDLV-USA Brand Introduces New Sesame Street Fitness Apparel - PR Newswire
| Price to Book Value: P/BV, a ratio used to compare book value to its current market price, to gauge whether a stock is valued properly. |
Neutral |
| Price to Earnings: PE, the ratio for valuing a company that measures its current share price relative to its earnings per share (EPS). |
Neutral |
| Discounted cash flow: DCF, a valuation method used to estimate the value of an investment based on its expected future cash flows. |
Neutral |
| Return on Assets: ROA, indicates how profitable a company is in relation to its total assets, how efficiently uses assets to generate a profit. |
Neutral |
| Return on Equity: ROE, a measure of financial performance calculated by dividing net income by equity. a gauge of profitability and efficiency. |
Neutral |
| Debt to Equity: evaluate financial leverage, reflects the ability of equity to cover outstanding debts in the event of a business downturn. |
Neutral |
|
Exchange:
|
|
|
Sector:
|
|
|
Industry:
|
|
| Shares Out | 0 (M) |
| Shares Float | 0 (M) |
| Held by Insiders | 0 (%) |
| Held by Institutions | 0 (%) |
| Shares Short | 0 (K) |
| Shares Short P.Month | 0 (K) |
| EPS | 0 |
| EPS Est Next Qtrly | 0 |
| EPS Est This Year | 0 |
| EPS Est Next Year | 0 |
| Book Value (p.s.) | 0 |
| Profit Margin | 0 % |
| Operating Margin | 0 % |
| Return on Assets (ttm) | 0 % |
| Return on Equity (ttm) | 0 % |
| Qtrly Rev. Growth | 0 % |
| Gross Profit (p.s.) | 0 |
| Sales Per Share | 0 |
| EBITDA (p.s.) | 0 |
| Qtrly Earnings Growth | 0 % |
| Operating Cash Flow | 0 (M) |
| Levered Free Cash Flow | 0 (M) |
| PE Ratio | 0 |
| PEG Ratio | 0 |
| Price to Book value | 0 |
| Price to Sales | 0 |
| Price to Cash Flow | 0 |
| Dividend | 0 |
| Forward Dividend | 0 |
| Dividend Yield | 0% |
| Dividend Pay Date | Invalid DateTime. |
| Ex-Dividend Date | Invalid DateTime. |

|

|
|

|
|
|
|
|
|