| 0 (0%) | 04-19 22:21 | |||||||||||||
|
|
| Short term | |
|||
| Mid term | ||||
| Targets | 6-month : | 3883.59 |
1-year : | 4536.04 |
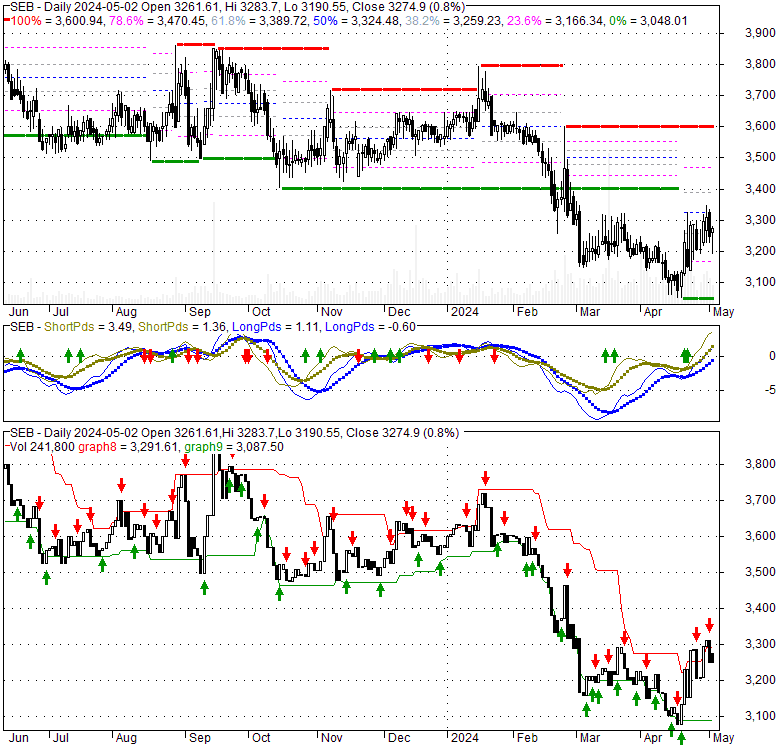
| Resists | First : | 3325 |
Second : | 3883.59 |
| Pivot price | 3156.75 |
|||
| Supports | First : | 3153.82 |
Second : | 3048.01 |
| MAs | MA(5) : | 3134.16 |
MA(20) : | 3170.53 |
| MA(100) : | 3429.92 |
MA(250) : | 3566.28 |
|
| MACD | MACD : | -35.8 |
Signal : | -43.8 |
| %K %D | K(14,3) : | 45.6 |
D(3) : | 31.9 |
| RSI | RSI(14): 53.9 |
|||
| 52-week | High : | 4080.11 | Low : | 3048.01 |
Price has closed above its short-term moving average. Short-term moving average is currently below mid-term; and below long-term moving average. From the relationship between price and moving averages: This stock is NEUTRAL in short-term; and BEARISH in mid-long term.[ SEB ] has closed below upper band by 9.3%. Bollinger Bands are 2.1% narrower than normal. The current width of the bands does not suggest anything about the future direction or movement of prices.
| If tomorrow: | Open lower | Open higher |
| High: | 3271.83 - 3284.41 | 3284.41 - 3298.86 |
| Low: | 3086.03 - 3099.24 | 3099.24 - 3114.42 |
| Close: | 3204.37 - 3226.11 | 3226.11 - 3251.1 |
Mon, 01 Apr 2024
HSEB chief: Will initiate digital marking from 2024-25 session - The Tribune India
Fri, 05 Jan 2024
HSEB 2024 Board Exam Dates Out, Exams From 27 February - Sarvgyan News
Sat, 23 Dec 2023
HSEB class XII supplementary exam result released - EducationTimes.com - Education Times
Fri, 10 Nov 2023
Miller Hull's new health sciences building features an opaque facade - The Architect's Newspaper
Sun, 25 Jun 2023
State to tweak teacher test’s syllabus soon - The Times of India
Sun, 11 Jun 2023
IB faculty set to train govt teachers, design 4 programmes in 20 schools - The Times of India
| Price to Book Value: P/BV, a ratio used to compare book value to its current market price, to gauge whether a stock is valued properly. |
Neutral |
| Price to Earnings: PE, the ratio for valuing a company that measures its current share price relative to its earnings per share (EPS). |
Neutral |
| Discounted cash flow: DCF, a valuation method used to estimate the value of an investment based on its expected future cash flows. |
Neutral |
| Return on Assets: ROA, indicates how profitable a company is in relation to its total assets, how efficiently uses assets to generate a profit. |
Neutral |
| Return on Equity: ROE, a measure of financial performance calculated by dividing net income by equity. a gauge of profitability and efficiency. |
Neutral |
| Debt to Equity: evaluate financial leverage, reflects the ability of equity to cover outstanding debts in the event of a business downturn. |
Neutral |
|
Exchange:
|
|
|
Sector:
|
|
|
Industry:
|
|
| Shares Out | 303 (M) |
| Shares Float | 0 (M) |
| Held by Insiders | 971050 (%) |
| Held by Institutions | 242800 (%) |
| Shares Short | 0 (K) |
| Shares Short P.Month | 0 (K) |
| EPS | 4.48e+008 |
| EPS Est Next Qtrly | 0 |
| EPS Est This Year | 0 |
| EPS Est Next Year | 0 |
| Book Value (p.s.) | -13.7 |
| Profit Margin | 0 % |
| Operating Margin | 3.8 % |
| Return on Assets (ttm) | 2.8 % |
| Return on Equity (ttm) | 1.3 % |
| Qtrly Rev. Growth | 9.95e+009 % |
| Gross Profit (p.s.) | -0.01 |
| Sales Per Share | 0 |
| EBITDA (p.s.) | 3.39 |
| Qtrly Earnings Growth | 331.5 % |
| Operating Cash Flow | 0 (M) |
| Levered Free Cash Flow | 0 (M) |
| PE Ratio | 0 |
| PEG Ratio | 0 |
| Price to Book value | -235.74 |
| Price to Sales | 1.26103e+011 |
| Price to Cash Flow | 2.44639e+011 |
| Dividend | 1780 |
| Forward Dividend | 2130 |
| Dividend Yield | 55.1% |
| Dividend Pay Date | Invalid DateTime. |
| Ex-Dividend Date | 2023-02-25 |

|

|
|

|
|
|
|
|
|