| 2.38 0.01 (0.42%) | 05-03 00:00 | |||||||||||||
|
|
| Short term | |
|||
| Mid term | |
|||
| Targets | 6-month : | 2.82 | 1-year : | 2.89 |
| Resists | First : | 2.42 | Second : | 2.48 |
| Pivot price | 2.38 | |||
| Supports | First : | 2.32 | Second : | 1.93 |
| MAs | MA(5) : | 2.38 | MA(20) : | 2.38 |
| MA(100) : | 2.38 | MA(250) : | 2.66 |
|
| MACD | MACD : | -0.1 |
Signal : | -0.1 |
| %K %D | K(14,3) : | 33.3 | D(3) : | 33.3 |
| RSI | RSI(14): 45.3 | |||
| 52-week | High : | 4.73 | Low : | 1.6 |
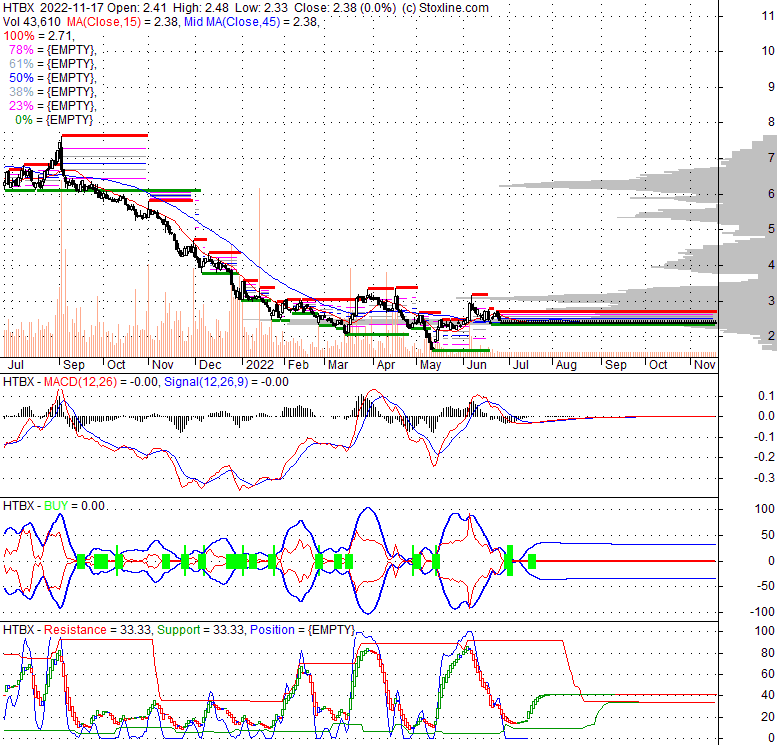
Price has closed below its short-term moving average. Short-term moving average is currently below mid-term; and below long-term moving average. From the relationship between price and moving averages: This stock is NEUTRAL in short-term; and NEUTRAL in mid-long term.[ HTBX ] has closed above bottom band by 50.0%. Bollinger Bands are 100% narrower than normal. The narrow width of the bands suggests low volatility as compared to its normal range. The bands have been in this narrow range for 94 bars. This is a sign that the market may be about to initiate a new trend.
| If tomorrow: | Open lower | Open higher |
| High: | 2.49 - 2.5 | 2.5 - 2.51 |
| Low: | 2.3 - 2.31 | 2.31 - 2.33 |
| Close: | 2.36 - 2.38 | 2.38 - 2.4 |
Heat Biologics, Inc., an integrated biopharmaceutical company, engages in the development of immune therapies and vaccines. The company's therapies are used to modulate the immune system against various diseases, including cancer and infectious diseases. Its gp96 platform, including ImPACT, an allogenic cell-based, T-cell-stimulating platform that functions as an immune activator to stimulate and expand T-cells; and ComPACT, which delivers antigen driven T-cell activation and specific co-stimulation in a single product. The company develops HS-110, which has completed enrollment in a Phase II clinical trial to treat patients with advanced non-small cell lung cancer; and HS-130 that is in Phase I clinical trial for the treatment of advanced solid tumors. Its products also include PTX-35, a novel T-cell co-stimulator agonist antibody targeting DR3/TNFRSF25 that is in Phase I clinical trial; DR3/TNFRSF25 for various immunotherapy approaches; and COVID-19 vaccine, which is in preclinical stage. Heat Biologics, Inc. has a collaboration with Dr. James Shapiro at University of Alberta to manufacture surrogate mouse version of PTX-35. The company was incorporated in 2008 and is headquartered in Morrisville, North Carolina.
Tue, 03 May 2022
Heat Biologics Completes Name Change to NightHawk Biosciences; Trading to Commence Under “NHWK” Effective at ... - GlobeNewswire
Wed, 20 Apr 2022
Heat Biologics (“NightHawk Biosciences”) Completes Acquisition of Elusys Therapeutics - GlobeNewswire
Tue, 13 Oct 2020
Heat Biologics Inc. (NASDAQ:HTBX) Receives Another Patent For gp96 technology platform in combination with T-Cell ... - BP Journal
Mon, 03 Aug 2020
Heat Biologics Inc. (NASDAQ:HTBX) Regains Its Continued Listing on the NASDAQ Stock Market - BP Journal
Mon, 06 Jul 2020
Heat Biologics Inc (NASDAQ:HTBX PTX-35) Administers PTX-35 To The First Patient At Its First Clinical Trial Site - BP Journal
Tue, 23 Jun 2020
Heat Biologics doses first patient in its Phase 1 clinical trial evaluating anti-cancer drug PTX-35 - Proactive Investors Australia
| Price to Book Value: P/BV, a ratio used to compare book value to its current market price, to gauge whether a stock is valued properly. |
Outperform |
| Price to Earnings: PE, the ratio for valuing a company that measures its current share price relative to its earnings per share (EPS). |
Underperform |
| Discounted cash flow: DCF, a valuation method used to estimate the value of an investment based on its expected future cash flows. |
Outperform |
| Return on Assets: ROA, indicates how profitable a company is in relation to its total assets, how efficiently uses assets to generate a profit. |
Neutral |
| Return on Equity: ROE, a measure of financial performance calculated by dividing net income by equity. a gauge of profitability and efficiency. |
Neutral |
| Debt to Equity: evaluate financial leverage, reflects the ability of equity to cover outstanding debts in the event of a business downturn. |
Neutral |
|
Exchange:
AMEX
|
|
|
Sector:
Healthcare
|
|
|
Industry:
Biotechnology
|
|
| Shares Out | 0 (M) |
| Shares Float | 25 (M) |
| Held by Insiders | 2.429e+007 (%) |
| Held by Institutions | 5.1 (%) |
| Shares Short | 0 (K) |
| Shares Short P.Month | 0 (K) |
| EPS | -3.293e+007 |
| EPS Est Next Qtrly | 0 |
| EPS Est This Year | 0 |
| EPS Est Next Year | 0 |
| Book Value (p.s.) | 0 |
| Profit Margin | 0 % |
| Operating Margin | -1 % |
| Return on Assets (ttm) | 587.3 % |
| Return on Equity (ttm) | -17.2 % |
| Qtrly Rev. Growth | 2.11e+006 % |
| Gross Profit (p.s.) | 5.33 |
| Sales Per Share | -103.74 |
| EBITDA (p.s.) | -5.57e+007 |
| Qtrly Earnings Growth | -1.2 % |
| Operating Cash Flow | 0 (M) |
| Levered Free Cash Flow | -38 (M) |
| PE Ratio | -0.01 |
| PEG Ratio | 0 |
| Price to Book value | 0 |
| Price to Sales | -0.03 |
| Price to Cash Flow | 0.14 |
| Dividend | 0 |
| Forward Dividend | 0 |
| Dividend Yield | 0% |
| Dividend Pay Date | 2020-12-10 |
| Ex-Dividend Date | Invalid DateTime. |

|

|
|

|
|
|
|
|
|