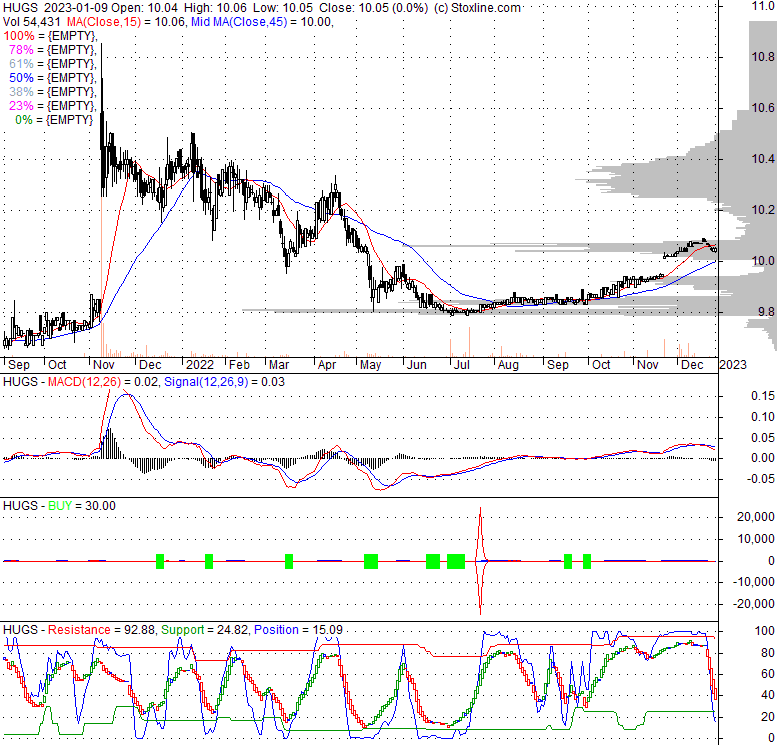
| 10.05 0 (0%) | 12-27 16:00 | |||||||||||||
|
|
| Short term | |
|||
| Mid term | ||||
| Targets | 6-month : | 11.78 | 1-year : | 13.76 |
| Resists | First : | 10.09 | Second : | 11.78 |
| Pivot price | 10.06 |
|||
| Supports | First : | 10.04 |
Second : | 10.01 |
| MAs | MA(5) : | 10.05 |
MA(20) : | 10.05 |
| MA(100) : | 9.92 |
MA(250) : | 10 |
|
| MACD | MACD : | 0 |
Signal : | 0 |
| %K %D | K(14,3) : | 20 |
D(3) : | 28.7 |
| RSI | RSI(14): 58.9 | |||
| 52-week | High : | 10.51 | Low : | 9.78 |
Price has closed below its short-term moving average. Short-term moving average is currently above mid-term; and above long-term moving average. From the relationship between price and moving averages: This stock is NEUTRAL in short-term; and BULLISH in mid-long term.[ HUGS ] has closed above bottom band by 21.3%. Bollinger Bands are 22.2% narrower than normal. The current width of the bands does not suggest anything about the future direction or movement of prices.
| If tomorrow: | Open lower | Open higher |
| High: | 10.09 - 10.14 | 10.14 - 10.19 |
| Low: | 9.87 - 9.95 | 9.95 - 10.02 |
| Close: | 9.93 - 10.05 | 10.05 - 10.15 |
USHG Acquisition Corp. does not have significant operations. It intends to effect a merger, share exchange, asset acquisition, stock purchase, reorganization, or related business combination with one or more businesses. The company was incorporated in 2020 and is based in New York, New York.
Mon, 07 Nov 2022
Panera, SPAC pull plug on partnership - Food Business News
Mon, 04 Jul 2022
Panera Brands puts IPO on ice after ending HUGS partnership - World Coffee Portal
Tue, 15 Feb 2022
What Type Of Shareholders Own The Most Number of USHG Acquisition Corp. (NYSE:HUGS) Shares? - Yahoo Finance
Thu, 11 Nov 2021
SPAC company partners with Panera Brands amid plan to go public - Food Business News
Tue, 09 Nov 2021
Panera Bread to go public — again — but this time with help from Danny Meyer - Chain Store Age
Tue, 09 Nov 2021
Panera Brands to go public and merge with Danny Meyer SPAC - Nation's Restaurant News
| Price to Book Value: P/BV, a ratio used to compare book value to its current market price, to gauge whether a stock is valued properly. |
Underperform |
| Price to Earnings: PE, the ratio for valuing a company that measures its current share price relative to its earnings per share (EPS). |
Outperform |
| Discounted cash flow: DCF, a valuation method used to estimate the value of an investment based on its expected future cash flows. |
Outperform |
| Return on Assets: ROA, indicates how profitable a company is in relation to its total assets, how efficiently uses assets to generate a profit. |
Neutral |
| Return on Equity: ROE, a measure of financial performance calculated by dividing net income by equity. a gauge of profitability and efficiency. |
Underperform |
| Debt to Equity: evaluate financial leverage, reflects the ability of equity to cover outstanding debts in the event of a business downturn. |
Underperform |
|
Exchange:
NYSE
|
|
|
Sector:
Financial Services
|
|
|
Industry:
Shell Companies
|
|
| Shares Out | 29 (M) |
| Shares Float | 24 (M) |
| Held by Insiders | 0 (%) |
| Held by Institutions | 69.1 (%) |
| Shares Short | 22 (K) |
| Shares Short P.Month | 23 (K) |
| EPS | 0 |
| EPS Est Next Qtrly | 0 |
| EPS Est This Year | 0 |
| EPS Est Next Year | 0 |
| Book Value (p.s.) | -0.69 |
| Profit Margin | 0 % |
| Operating Margin | 0 % |
| Return on Assets (ttm) | 0 % |
| Return on Equity (ttm) | 0 % |
| Qtrly Rev. Growth | 0 % |
| Gross Profit (p.s.) | 0 |
| Sales Per Share | 0 |
| EBITDA (p.s.) | 0 |
| Qtrly Earnings Growth | 0 % |
| Operating Cash Flow | -1 (M) |
| Levered Free Cash Flow | 0 (M) |
| PE Ratio | 0 |
| PEG Ratio | 0 |
| Price to Book value | -14.57 |
| Price to Sales | 0 |
| Price to Cash Flow | -293.98 |
| Dividend | 0 |
| Forward Dividend | 0 |
| Dividend Yield | 0% |
| Dividend Pay Date | Invalid DateTime. |
| Ex-Dividend Date | Invalid DateTime. |

|

|
|

|
|
|
|
|
|