
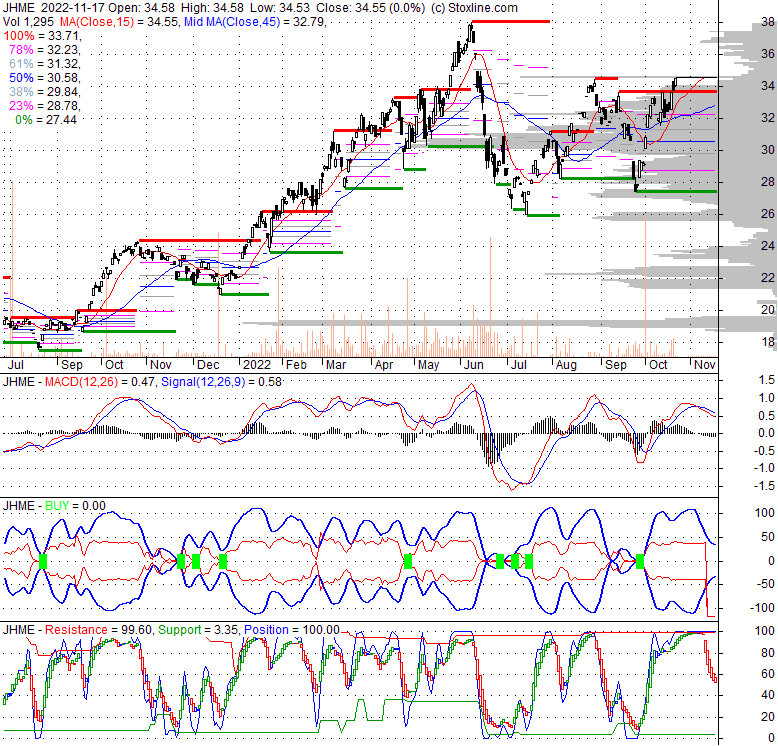
| 34.5527 0.038 (0.11%) | 10-24 15:53 | |||||||||||||
|
|
| Short term |  |
|||
| Mid term | |
|||
| Targets | 6-month : | 1-year : | ||
| Resists | First : | Second : | ||
| Pivot price | ||||
| Supports | First : | Second : | ||
| MAs | MA(5) : | MA(20) : | ||
| MA(100) : | MA(250) : | |||
| MACD | MACD : | Signal : | ||
| %K %D | K(14,3) : | D(3) : | ||
| RSI | RSI(14): | |||
| 52-week | High : | Low : | ||
| If tomorrow: | Open lower | Open higher |
| High: | - | - |
| Low: | - | - |
| Close: | - | - |
Under normal conditions, this exchange-traded fund commits a minimum of 80% of its net assets, including any capital borrowed for investment, to the securities that form its reference index. This underlying index is constructed from U.S. energy sector companies whose market capitalizations are greater than that of the 1,001st largest U.S. company at the time of its periodic rebalancing. The fund is classified as non-diversified.
Fri, 30 Oct 2026
Is John Hancock Multifactor Mid Cap ETF (JHMM) a Strong ETF Right Now? - Yahoo Finance
Thu, 29 Oct 2026
Should John Hancock Multifactor Small Cap ETF (JHSC) Be on Your Investing Radar? - Yahoo Finance
Tue, 22 Sep 2026
Is John Hancock Multifactor Large Cap ETF (JHML) a Strong ETF Right Now? - Yahoo Finance
Tue, 16 Jun 2026
Is John Hancock Multifactor Mid Cap ETF (JHMM) a Strong ETF Right Now? - Yahoo Finance
Fri, 12 Jun 2026
Should John Hancock Multifactor Mid Cap ETF (JHMM) Be on Your Investing Radar? - Yahoo Finance
Thu, 22 Sep 2022
John Hancock Investment Management announces changes to its ETF lineup - PR Newswire
| Price to Book Value: P/BV, a ratio used to compare book value to its current market price, to gauge whether a stock is valued properly. |
Neutral |
| Price to Earnings: PE, the ratio for valuing a company that measures its current share price relative to its earnings per share (EPS). |
Neutral |
| Discounted cash flow: DCF, a valuation method used to estimate the value of an investment based on its expected future cash flows. |
Neutral |
| Return on Assets: ROA, indicates how profitable a company is in relation to its total assets, how efficiently uses assets to generate a profit. |
Neutral |
| Return on Equity: ROE, a measure of financial performance calculated by dividing net income by equity. a gauge of profitability and efficiency. |
Neutral |
| Debt to Equity: evaluate financial leverage, reflects the ability of equity to cover outstanding debts in the event of a business downturn. |
Neutral |
|
Exchange:
AMEX
|
|
|
Sector:
Financial Services
|
|
|
Industry:
Asset Management
|
|
| Shares Out | 0 (M) |
| Shares Float | 0 (M) |
| Held by Insiders | (%) |
| Held by Institutions | (%) |
| Shares Short | 0 (K) |
| Shares Short P.Month | 0 (K) |
| EPS | |
| EPS Est Next Qtrly | |
| EPS Est This Year | |
| EPS Est Next Year | |
| Book Value (p.s.) | |
| Profit Margin | % |
| Operating Margin | % |
| Return on Assets (ttm) | % |
| Return on Equity (ttm) | % |
| Qtrly Rev. Growth | % |
| Gross Profit (p.s.) | |
| Sales Per Share | |
| EBITDA (p.s.) | |
| Qtrly Earnings Growth | % |
| Operating Cash Flow | 0 (M) |
| Levered Free Cash Flow | 0 (M) |
| PE Ratio | |
| PEG Ratio | |
| Price to Book value | |
| Price to Sales | |
| Price to Cash Flow |
| Dividend | |
| Forward Dividend | |
| Dividend Yield | 0% |
| Dividend Pay Date | |
| Ex-Dividend Date |

|

|

|

|
|
|
|
|
|