
| 93.94 -0.45 (-0.48%) | 10-19 16:00 | |||||||||||||
|
|
| Short term |  |
|||
| Mid term |  |
|||
| Targets | 6-month : | 112.76  |
1-year : | 115 |
| Resists | First : | 96.54 |
Second : | 98.45 |
| Pivot price | 94.65 |
|||
| Supports | First : | 93.44 | Second : | 77.75 |
| MAs | MA(5) : | 94.33 |
MA(20) : | 95.28 |
| MA(100) : | 95.16  |
MA(250) : | 88.53 |
|
| MACD | MACD : | -0.9 |
Signal : | -0.8 |
| %K %D | K(14,3) : | 22.5 |
D(3) : | 23.1 |
| RSI | RSI(14): 38.8 |
|||
| 52-week | High : | 100.2 | Low : | 73.05 |
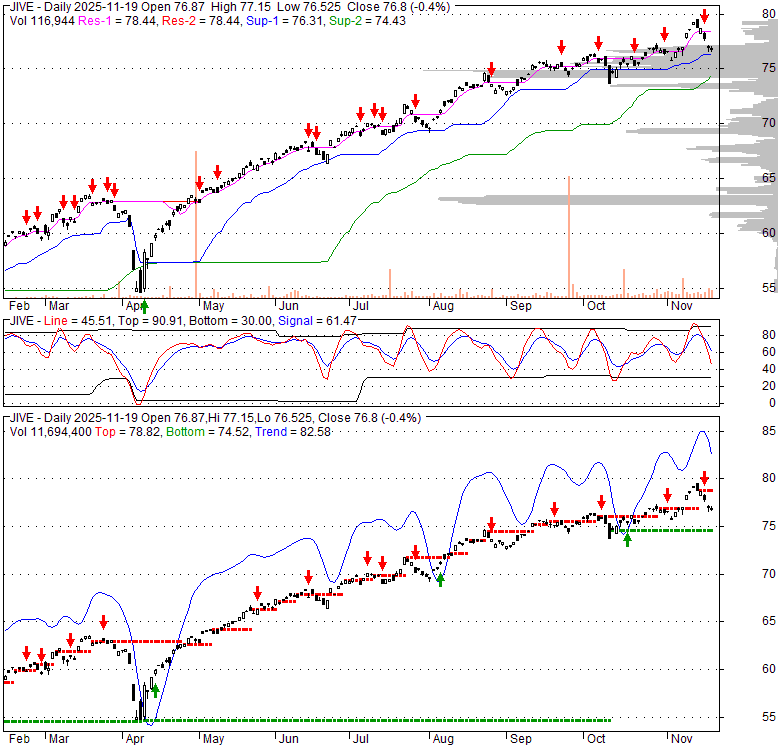
Price has closed below its short-term moving average. Short-term moving average is currently below mid-term; and below long-term moving average. From the relationship between price and moving averages: This stock is BEARISH in short-term; and NEUTRAL in mid-long term.[ JIVE ] has closed above bottom band by 20.4%. Bollinger Bands are 36.8% narrower than normal. The current width of the bands does not suggest anything about the future direction or movement of prices.
| If tomorrow: | Open lower | Open higher |
| High: | 94.56 - 95.15 | 95.15 - 95.57 |
| Low: | 92.34 - 93.09 | 93.09 - 93.62 |
| Close: | 92.96 - 94.05 | 94.05 - 94.82 |
The fund primarily allocates its capital to stocks and other equity-linked financial products from corporations located outside the United States, which can include the overseas operations of American companies. Its investment scope covers entities situated in both mature international markets and developing economies. Noteworthy developed foreign countries for investment include Australia, Canada, Israel, Japan, New Zealand, Singapore, the United Kingdom, the majority of Western European nations, and Hong Kong; most other countries worldwide are classified as emerging markets.
Fri, 16 Oct 2026
(JIVE) Movement Within Algorithmic Entry Frameworks - Stock Traders Daily
Tue, 06 Oct 2026
Understanding the Setup: (JIVE) and Scalable Risk - Stock Traders Daily
Tue, 15 Sep 2026
JIVE: International Value Star With Flashing Caution Lights - Seeking Alpha
Tue, 15 Sep 2026
JPMorgan International Value ETF rated Hold ami... - Pluang
Sat, 29 Aug 2026
JIVE: Leading International Value ETF Heavily Weighted In Financials (NASDAQ:JIVE) - Seeking Alpha
Mon, 17 Aug 2026
This ETF Is Outperforming by Avoiding the S&P 500’s Biggest Problem - Yahoo Finance
| Price to Book Value: P/BV, a ratio used to compare book value to its current market price, to gauge whether a stock is valued properly. |
Neutral |
| Price to Earnings: PE, the ratio for valuing a company that measures its current share price relative to its earnings per share (EPS). |
Neutral |
| Discounted cash flow: DCF, a valuation method used to estimate the value of an investment based on its expected future cash flows. |
Neutral |
| Return on Assets: ROA, indicates how profitable a company is in relation to its total assets, how efficiently uses assets to generate a profit. |
Neutral |
| Return on Equity: ROE, a measure of financial performance calculated by dividing net income by equity. a gauge of profitability and efficiency. |
Neutral |
| Debt to Equity: evaluate financial leverage, reflects the ability of equity to cover outstanding debts in the event of a business downturn. |
Neutral |
|
Exchange:
NASDAQ
|
|
|
Sector:
Financial Services
|
|
|
Industry:
Asset Management - Global
|
|
| Shares Out | 0 (M) |
| Shares Float | 0 (M) |
| Held by Insiders | 0 (%) |
| Held by Institutions | 0 (%) |
| Shares Short | 0 (K) |
| Shares Short P.Month | 0 (K) |
| EPS | 0 |
| EPS Est Next Qtrly | 0 |
| EPS Est This Year | 0 |
| EPS Est Next Year | 0 |
| Book Value (p.s.) | 0 |
| Profit Margin | 0 % |
| Operating Margin | 0 % |
| Return on Assets (ttm) | 0 % |
| Return on Equity (ttm) | 0 % |
| Qtrly Rev. Growth | 0 % |
| Gross Profit (p.s.) | 0 |
| Sales Per Share | 0 |
| EBITDA (p.s.) | 0 |
| Qtrly Earnings Growth | 0 % |
| Operating Cash Flow | 0 (M) |
| Levered Free Cash Flow | 0 (M) |
| PE Ratio | 0 |
| PEG Ratio | 0 |
| Price to Book value | 0 |
| Price to Sales | 0 |
| Price to Cash Flow | 0 |
| Dividend | 0 |
| Forward Dividend | 0 |
| Dividend Yield | 0% |
| Dividend Pay Date | Invalid DateTime. |
| Ex-Dividend Date | Invalid DateTime. |

|

|

|

|
|
|
|
|
|