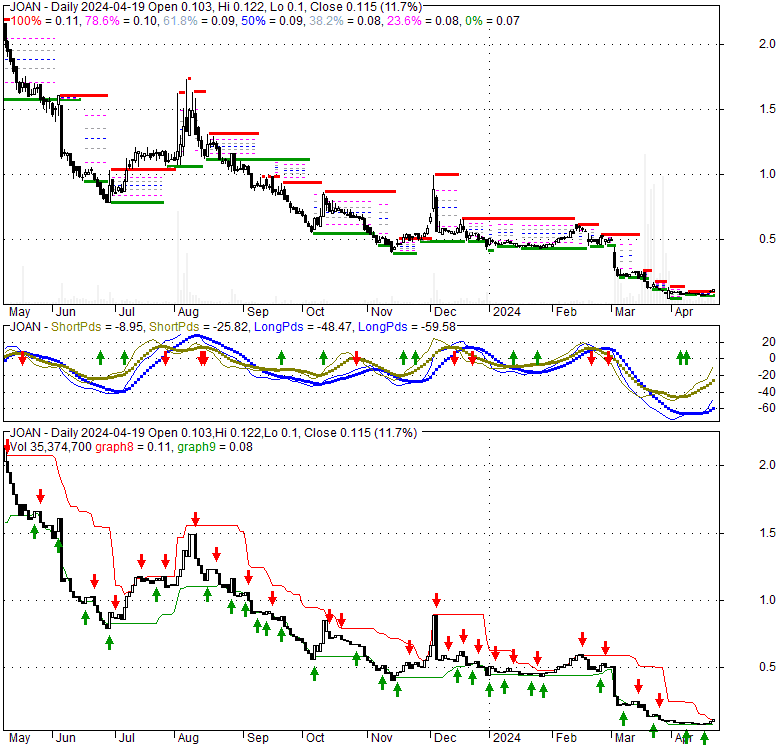
| 0.0969 0 (0%) | 03-27 16:00 | |||||||||||||
|
|
| Short term | |
|||
| Mid term | ||||
| Targets | 6-month : | 0.21 | 1-year : | 0.31 |
| Resists | First : | 0.18 | Second : | 0.26 |
| Pivot price | 0.09 |
|||
| Supports | First : | 0.04 | Second : | 0.03 |
| MAs | MA(5) : | 0.09 |
MA(20) : | 0.09 |
| MA(100) : | 0.39 |
MA(250) : | 0.79 |
|
| MACD | MACD : | -0.1 |
Signal : | -0.1 |
| %K %D | K(14,3) : | 62.7 |
D(3) : | 49.2 |
| RSI | RSI(14): 41.1 |
|||
| 52-week | High : | 2.19 | Low : | 0.04 |
Price has closed above its short-term moving average. Short-term moving average is currently below mid-term; and below long-term moving average. From the relationship between price and moving averages: This stock is NEUTRAL in short-term; and BEARISH in mid-long term.[ JOAN ] has closed It is unclear right now based on current values. 80.7% narrower than normal. The narrow width of the bands suggests low volatility as compared to its normal range. The bands have been in this narrow range for 9 bars. This is a sign that the market may be about to initiate a new trend.
| If tomorrow: | Open lower | Open higher |
| High: | 0.12 - 0.12 | 0.12 - 0.12 |
| Low: | 0.1 - 0.1 | 0.1 - 0.1 |
| Close: | 0.11 - 0.11 | 0.11 - 0.12 |
JOANN Inc. operates as a specialty retailer of sewing and fabrics, and arts and crafts category products in the United States. Its products in sewing category include cotton fabrics; warm fabrics, such as fleece and flannel fabrics; home decorating and utility fabrics and accessories; fashion and sportswear fabrics; special occasion fabrics; seasonally themed and licensed fabric designs; and sewing construction supplies comprising cutting implements, threads, zippers, trims, tapes, pins, elastic, and buttons, as well as patterns for sewing projects. The company's products in arts and crafts, home décor, and other category consist of yarn and yarn accessories, and needlecraft kits and supplies; paper crafting components; craft materials; fine art materials; sewing machines, craft technology, lighting, irons, organizers, and other products; artificial floral products; seasonal décor and entertaining products; home décor accessories; ready-made frames; comprehensive assortment books and magazines; and non-merchandise services. JOANN Inc. offers its products through retail stores, as well as online. As of March 21, 2022, it operated 848 retail stores in 49 states. The company was formerly known as Jo-Ann Stores Holdings Inc. and changed its name to JOANN Inc. in February 2021. JOANN Inc. was founded in 1943 and is based in Hudson, Ohio.
Wed, 27 Mar 2024
Joann (JOAN) Stock Plunges Ahead of Nasdaq Suspension - InvestorPlace
Fri, 22 Mar 2024
JOANN Inc (JOAN) Stock to Be Delisted on March 28th - StreetInsider.com
Mon, 18 Mar 2024
JOAN Stock Alert: Joann Finally Files for Ch. 11 Bankruptcy - InvestorPlace
Mon, 18 Mar 2024
JOANN Inc (JOAN) Enters Agreement to Reduce Debt and Receive $132 Mln in New Capital - StreetInsider.com
Tue, 05 Mar 2024
Retail REITs' exposure to struggling Joann 'relatively low,' Wells Fargo says (JOAN) - Seeking Alpha
Sat, 02 Mar 2024
Crafts Retailer Joann Is Planning a Bankruptcy Filing That Would Hand Keys to Lenders - Bloomberg
| Price to Book Value: P/BV, a ratio used to compare book value to its current market price, to gauge whether a stock is valued properly. |
Underperform |
| Price to Earnings: PE, the ratio for valuing a company that measures its current share price relative to its earnings per share (EPS). |
Underperform |
| Discounted cash flow: DCF, a valuation method used to estimate the value of an investment based on its expected future cash flows. |
Outperform |
| Return on Assets: ROA, indicates how profitable a company is in relation to its total assets, how efficiently uses assets to generate a profit. |
Underperform |
| Return on Equity: ROE, a measure of financial performance calculated by dividing net income by equity. a gauge of profitability and efficiency. |
Outperform |
| Debt to Equity: evaluate financial leverage, reflects the ability of equity to cover outstanding debts in the event of a business downturn. |
Underperform |

|
Exchange:
NASDAQ
|
|
|
Sector:
Consumer Cyclical
|
|
|
Industry:
Specialty Retail
|
|
| Shares Out | 42 (M) |
| Shares Float | 12 (M) |
| Held by Insiders | 3.9 (%) |
| Held by Institutions | 72.1 (%) |
| Shares Short | 1,660 (K) |
| Shares Short P.Month | 2,310 (K) |
| EPS | -5.81 |
| EPS Est Next Qtrly | 0 |
| EPS Est This Year | 0 |
| EPS Est Next Year | 0 |
| Book Value (p.s.) | -4.37 |
| Profit Margin | -11.2 % |
| Operating Margin | -2.6 % |
| Return on Assets (ttm) | -2.9 % |
| Return on Equity (ttm) | 0 % |
| Qtrly Rev. Growth | -4.1 % |
| Gross Profit (p.s.) | 0 |
| Sales Per Share | 51.53 |
| EBITDA (p.s.) | -0.79 |
| Qtrly Earnings Growth | 0 % |
| Operating Cash Flow | -53 (M) |
| Levered Free Cash Flow | -36 (M) |
| PE Ratio | -0.02 |
| PEG Ratio | 0 |
| Price to Book value | -0.03 |
| Price to Sales | 0 |
| Price to Cash Flow | -0.1 |
| Dividend | 0.1 |
| Forward Dividend | 0 |
| Dividend Yield | 95.6% |
| Dividend Pay Date | Invalid DateTime. |
| Ex-Dividend Date | Invalid DateTime. |