
| 43.44 0.03 (0.07%) | 10-16 16:00 | |||||||||||||
|
|
| Short term |  |
|||
| Mid term |  |
|||
| Targets | 6-month : | 51.69 | 1-year : | 53.44 |
| Resists | First : | 44.25 | Second : | 45.75 |
| Pivot price | 43.58  |
|||
| Supports | First : | 41.83 | Second : | 34.8 |
| MAs | MA(5) : | 42.95  |
MA(20) : | 43.66 |
| MA(100) : | 45.09 |
MA(250) : | 44.63 |
|
| MACD | MACD : | -0.5 |
Signal : | -0.5 |
| %K %D | K(14,3) : | 41.9 |
D(3) : | 30.5 |
| RSI | RSI(14): 46.4 |
|||
| 52-week | High : | 52.76 | Low : | 34.64 |
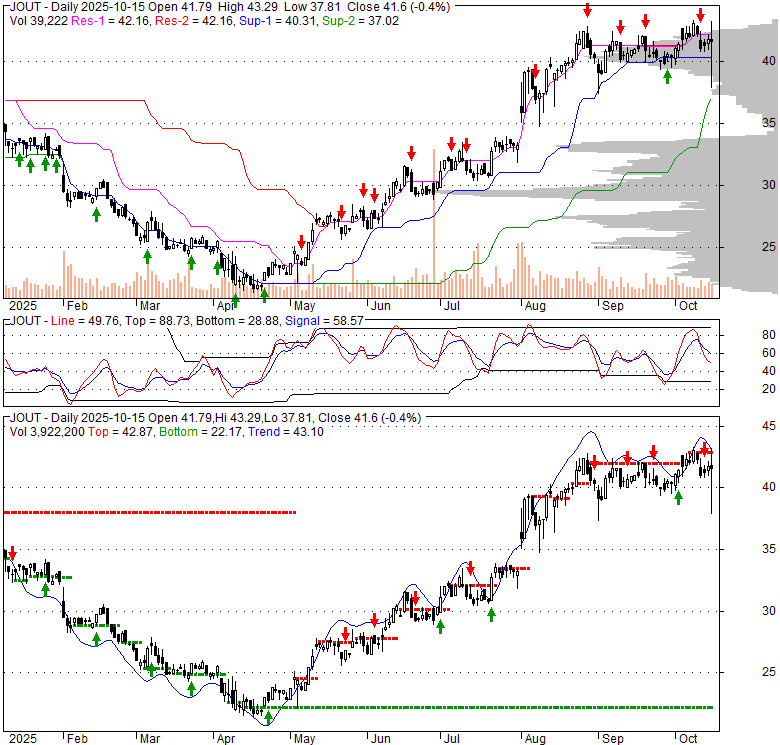
Price has closed above its short-term moving average. Short-term moving average is currently below mid-term; and below long-term moving average. From the relationship between price and moving averages: This stock is NEUTRAL in short-term; and BEARISH in mid-long term.[ JOUT ] has closed above bottom band by 44.4%. Bollinger Bands are 33.8% narrower than normal. The current width of the bands does not suggest anything about the future direction or movement of prices.
| If tomorrow: | Open lower | Open higher |
| High: | 44.08 - 44.25 | 44.25 - 44.45 |
| Low: | 42.44 - 42.63 | 42.63 - 42.84 |
| Close: | 43.1 - 43.39 | 43.39 - 43.73 |
Johnson Outdoors, Inc. engages in the manufacturing and marketing of seasonal, outdoor recreation products. It operates through the following segments: Fishing, Camping, Watercraft Recreation, Diving, and Other. The Fishing segment includes the brands Minn Kota electric motors for quiet trolling or primary propulsion, marine battery chargers, and shallow water anchors, Humminbird sonar and GPS equipment for fishfinding, navigation and marine cartography, and Cannon downriggers for controlled-depth fishing. The Camping segment consists of Eureka! Consumer, commercial and military tents and accessories, sleeping bags, camping furniture and stoves and other recreational camping products, and Jetboil portable outdoor cooking systems. The Watercraft Recreation segment designs and markets canoes and kayaks, including pedal-driven and Minn Kota motor-driven kayaks, under the Ocean Kayaks and Old Town brand names for family recreation, touring, angling, and tripping. The Diving segment sells and distributes the SCUBAPRO brand. The company was founded by Samuel Curtis Johnson II in 1987 and is headquartered in Racine, WI.
Thu, 15 Oct 2026
Johnson Outdoors declares USD 0.33 dividend for Johnson Outdoors stock - ad-hoc-news.de
Wed, 14 Oct 2026
Johnson Outdoors: Stable Dividend From A Debt-Free Balance Sheet (NASDAQ:JOUT) - Seeking Alpha
Mon, 05 Oct 2026
It Might Not Be A Great Idea To Buy Johnson Outdoors Inc. (NASDAQ:JOUT) For Its Next Dividend - Simply Wall Street
Sat, 03 Oct 2026
Zacks Research Downgrades Johnson Outdoors (NASDAQ:JOUT) to Strong Sell - MarketBeat
Mon, 28 Sep 2026
Is Johnson Outdoors (NASDAQ:JOUT) Rewriting the Dividend Stocks Playbook? - Kalkine Media
Sat, 26 Sep 2026
Johnson Outdoors Declares Quarterly Cash Dividend to Shareholders - The Globe and Mail
| Price to Book Value: P/BV, a ratio used to compare book value to its current market price, to gauge whether a stock is valued properly. |
Outperform |
| Price to Earnings: PE, the ratio for valuing a company that measures its current share price relative to its earnings per share (EPS). |
Underperform |
| Discounted cash flow: DCF, a valuation method used to estimate the value of an investment based on its expected future cash flows. |
Outperform |
| Return on Assets: ROA, indicates how profitable a company is in relation to its total assets, how efficiently uses assets to generate a profit. |
Underperform |
| Return on Equity: ROE, a measure of financial performance calculated by dividing net income by equity. a gauge of profitability and efficiency. |
Underperform |
| Debt to Equity: evaluate financial leverage, reflects the ability of equity to cover outstanding debts in the event of a business downturn. |
Outperform |
|
Exchange:
NASDAQ
|
|
|
Sector:
Consumer Cyclical
|
|
|
Industry:
Leisure
|
|
| Shares Out | 9 (M) |
| Shares Float | 6 (M) |
| Held by Insiders | 8.7 (%) |
| Held by Institutions | 71.4 (%) |
| Shares Short | 432 (K) |
| Shares Short P.Month | 457 (K) |
| EPS | -0.83 |
| EPS Est Next Qtrly | 0 |
| EPS Est This Year | 0 |
| EPS Est Next Year | 0 |
| Book Value (p.s.) | 41.74 |
| Profit Margin | -1.3 % |
| Operating Margin | 9.6 % |
| Return on Assets (ttm) | 1.7 % |
| Return on Equity (ttm) | -1.9 % |
| Qtrly Rev. Growth | 5 % |
| Gross Profit (p.s.) | 28.27 |
| Sales Per Share | 71.29 |
| EBITDA (p.s.) | 4.09 |
| Qtrly Earnings Growth | 89.3 % |
| Operating Cash Flow | 50 (M) |
| Levered Free Cash Flow | 25 (M) |
| PE Ratio | -52.34 |
| PEG Ratio | 2.2 |
| Price to Book value | 1.04 |
| Price to Sales | 0.6 |
| Price to Cash Flow | 7.99 |
| Dividend | 0.33 |
| Forward Dividend | 0 |
| Dividend Yield | 0.7% |
| Dividend Pay Date | Invalid DateTime. |
| Ex-Dividend Date | Invalid DateTime. |

|

|

|

|
|
|
|
|
|