| 0 (0%) | 04-26 02:22 | |||||||||||||
|
|
| Short term | |
|||
| Mid term | |
|||
| Targets | 6-month : | 22.26 |
1-year : | 22.67 |
| Resists | First : | 19.06 |
Second : | 19.4 |
| Pivot price | 18.99 |
|||
| Supports | First : | 18.5 | Second : | 15.39 |
| MAs | MA(5) : | 18.8 | MA(20) : | 19.03 |
| MA(100) : | 20.03 |
MA(250) : | 21.03 |
|
| MACD | MACD : | -0.2 |
Signal : | -0.2 |
| %K %D | K(14,3) : | 0 | D(3) : | 0 |
| RSI | RSI(14): 38.9 | |||
| 52-week | High : | 23.63 | Low : | 18.5 |
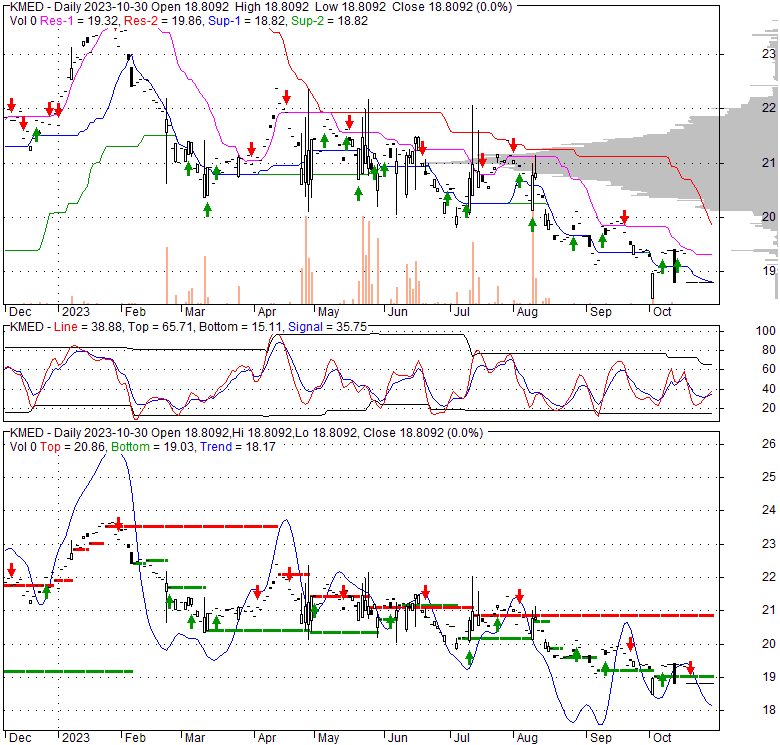
Price has closed below its short-term moving average. Short-term moving average is currently below mid-term; and below long-term moving average. From the relationship between price and moving averages: This stock is NEUTRAL in short-term; and BEARISH in mid-long term.[ KMED ] has closed above bottom band by 32.3%. Bollinger Bands are 2.9% narrower than normal. The current width of the bands does not suggest anything about the future direction or movement of prices.
| If tomorrow: | Open lower | Open higher |
| High: | 18.85 - 18.95 | 18.95 - 19.02 |
| Low: | 18.55 - 18.68 | 18.68 - 18.78 |
| Close: | 18.63 - 18.82 | 18.82 - 18.98 |
Fri, 26 Apr 2024
HMM enhances maritime safety with AI technology - Korea Economic Daily
Thu, 25 Apr 2024
Korea’s Lotte sells Lotte Glory Properties Shenyang amid US-China dispute - Korea Economic Daily
Thu, 25 Apr 2024
HYBE conflict vs NewJeans label to escalate into legal fight - Korea Economic Daily
Thu, 25 Apr 2024
Honda, POSCO Future M to build cell material plant in Canada - Korea Economic Daily
Thu, 25 Apr 2024
Korean Air to launch Incheon-Macau route in July - Korea Economic Daily
Thu, 25 Apr 2024
Starfield launches 4th annual balloon festival with iconic character displays - Korea Economic Daily
| Price to Book Value: P/BV, a ratio used to compare book value to its current market price, to gauge whether a stock is valued properly. |
Neutral |
| Price to Earnings: PE, the ratio for valuing a company that measures its current share price relative to its earnings per share (EPS). |
Neutral |
| Discounted cash flow: DCF, a valuation method used to estimate the value of an investment based on its expected future cash flows. |
Neutral |
| Return on Assets: ROA, indicates how profitable a company is in relation to its total assets, how efficiently uses assets to generate a profit. |
Neutral |
| Return on Equity: ROE, a measure of financial performance calculated by dividing net income by equity. a gauge of profitability and efficiency. |
Neutral |
| Debt to Equity: evaluate financial leverage, reflects the ability of equity to cover outstanding debts in the event of a business downturn. |
Neutral |
|
Exchange:
|
|
|
Sector:
|
|
|
Industry:
|
|
| Shares Out | 0 (M) |
| Shares Float | 0 (M) |
| Held by Insiders | 0 (%) |
| Held by Institutions | 0 (%) |
| Shares Short | 0 (K) |
| Shares Short P.Month | 0 (K) |
| EPS | 0 |
| EPS Est Next Qtrly | 0 |
| EPS Est This Year | 0 |
| EPS Est Next Year | 0 |
| Book Value (p.s.) | 0 |
| Profit Margin | 0 % |
| Operating Margin | 0 % |
| Return on Assets (ttm) | 0 % |
| Return on Equity (ttm) | 0 % |
| Qtrly Rev. Growth | 0 % |
| Gross Profit (p.s.) | 0 |
| Sales Per Share | 0 |
| EBITDA (p.s.) | 0 |
| Qtrly Earnings Growth | 0 % |
| Operating Cash Flow | 0 (M) |
| Levered Free Cash Flow | 0 (M) |
| PE Ratio | 0 |
| PEG Ratio | 0 |
| Price to Book value | 0 |
| Price to Sales | 0 |
| Price to Cash Flow | 0 |
| Dividend | 0 |
| Forward Dividend | 0 |
| Dividend Yield | 0% |
| Dividend Pay Date | Invalid DateTime. |
| Ex-Dividend Date | Invalid DateTime. |

|

|
|

|
|
|
|
|
|