
| 66.795 0.415 (0.63%) | 09-02 16:00 | |||||||||||||
|
|
| Short term |   |
|||
| Mid term |  |
|||
| Targets | 6-month : | 78.57 | 1-year : | 91.77 |
| Resists | First : | 67.27 | Second : | 78.57 |
| Pivot price | 66.72 |
|||
| Supports | First : | 65.7 |
Second : | 64.73 |
| MAs | MA(5) : | 66.81 |
MA(20) : | 66.64 |
| MA(100) : | 64.44 |
MA(250) : | 60.48 |
|
| MACD | MACD : | 0.4 |
Signal : | 0.4 |
| %K %D | K(14,3) : | 51.6 |
D(3) : | 60.9 |
| RSI | RSI(14): 56.8 |
|||
| 52-week | High : | 67.27 | Low : | 52.99 |
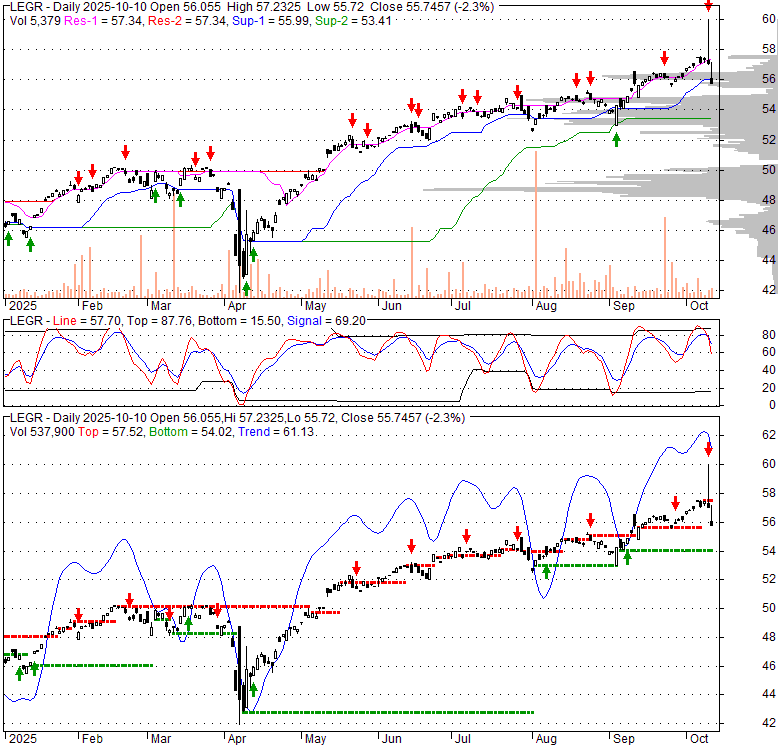
Price has closed below its short-term moving average. Short-term moving average is currently above mid-term; and above long-term moving average. From the relationship between price and moving averages: This stock is NEUTRAL in short-term; and BULLISH in mid-long term.[ LEGR ] has closed below upper band by 43.9%. Bollinger Bands are 67% narrower than normal. The narrow width of the bands suggests low volatility as compared to its normal range. The bands have been in this narrow range for 9 bars. This is a sign that the market may be about to initiate a new trend.
| If tomorrow: | Open lower | Open higher |
| High: | 66.83 - 67.16 | 67.16 - 67.49 |
| Low: | 65.93 - 66.28 | 66.28 - 66.63 |
| Close: | 66.24 - 66.79 | 66.79 - 67.34 |
The First Trust Indxx Innovative Transaction & Process ETF (LEGR) aims to replicate the total returns, before deducting its fees and expenses, of the Indxx Blockchain Index. To achieve this, the Fund typically allocates at least 90% of its net assets, including any borrowed funds, to the common equities and depositary receipts that constitute this underlying index. The Indxx Blockchain Index itself is crafted to monitor the progress of companies significantly involved with distributed ledger technology (blockchain). This includes firms actively utilizing, investing in, or developing blockchain solutions, as well as those with products positioned to benefit from the technology's inherent capacity to enhance efficiency across various business operations. Crucially, the Index exclusively selects companies that have dedicated substantial resources to integrating or advancing blockchain applications. Indxx, Inc., acting as the Index Provider, is responsible for the ownership, development, maintenance, and sponsorship of this Index.
| Price to Book Value: P/BV, a ratio used to compare book value to its current market price, to gauge whether a stock is valued properly. |
Neutral |
| Price to Earnings: PE, the ratio for valuing a company that measures its current share price relative to its earnings per share (EPS). |
Neutral |
| Discounted cash flow: DCF, a valuation method used to estimate the value of an investment based on its expected future cash flows. |
Neutral |
| Return on Assets: ROA, indicates how profitable a company is in relation to its total assets, how efficiently uses assets to generate a profit. |
Neutral |
| Return on Equity: ROE, a measure of financial performance calculated by dividing net income by equity. a gauge of profitability and efficiency. |
Neutral |
| Debt to Equity: evaluate financial leverage, reflects the ability of equity to cover outstanding debts in the event of a business downturn. |
Neutral |
|
Exchange:
NASDAQ
|
|
|
Sector:
Financial Services
|
|
|
Industry:
Asset Management
|
|
| Shares Out | 0 (M) |
| Shares Float | 0 (M) |
| Held by Insiders | 0 (%) |
| Held by Institutions | 0 (%) |
| Shares Short | 0 (K) |
| Shares Short P.Month | 0 (K) |
| EPS | 0 |
| EPS Est Next Qtrly | 0 |
| EPS Est This Year | 0 |
| EPS Est Next Year | 0 |
| Book Value (p.s.) | 0 |
| Profit Margin | 0 % |
| Operating Margin | 0 % |
| Return on Assets (ttm) | 0 % |
| Return on Equity (ttm) | 0 % |
| Qtrly Rev. Growth | 0 % |
| Gross Profit (p.s.) | 0 |
| Sales Per Share | 0 |
| EBITDA (p.s.) | 0 |
| Qtrly Earnings Growth | 0 % |
| Operating Cash Flow | 0 (M) |
| Levered Free Cash Flow | 0 (M) |
| PE Ratio | 0 |
| PEG Ratio | 0 |
| Price to Book value | 0 |
| Price to Sales | 0 |
| Price to Cash Flow | 0 |
| Dividend | 0 |
| Forward Dividend | 0 |
| Dividend Yield | 0% |
| Dividend Pay Date | Invalid DateTime. |
| Ex-Dividend Date | Invalid DateTime. |

|

|
|

|
|
|
|
|
|