
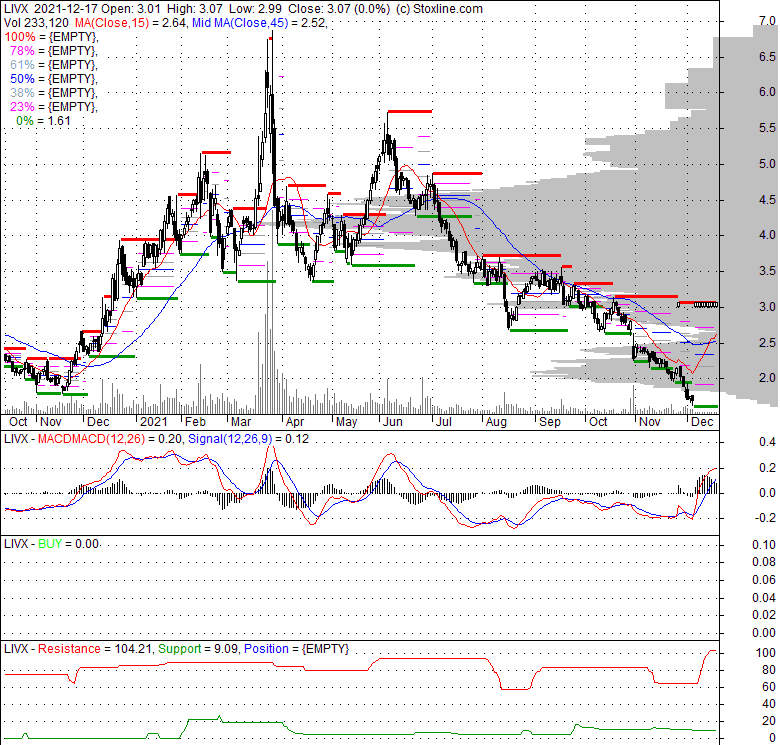
| 3.07 0.06 (1.99%) | 10-06 00:00 | |||||||||||||
|
|
| Short term |  |
|||
| Mid term | |
|||
| Targets | 6-month : | 1-year : | ||
| Resists | First : | Second : | ||
| Pivot price | ||||
| Supports | First : | Second : | ||
| MAs | MA(5) : | MA(20) : | ||
| MA(100) : | MA(250) : | |||
| MACD | MACD : | Signal : | ||
| %K %D | K(14,3) : | D(3) : | ||
| RSI | RSI(14): | |||
| 52-week | High : | Low : | ||
| If tomorrow: | Open lower | Open higher |
| High: | - | - |
| Low: | - | - |
| Close: | - | - |
LiveXLive Media, Inc. is a digital media firm primarily involved in securing, distributing, and generating revenue from a diverse range of audio and video content. This includes live music events, internet radio, podcasts, and various music streaming services. The company, which is based in West Hollywood, California, currently sustains a workforce of 76 full-time employees. Its core business revolves around delivering live music and related video experiences. LiveXLive offers an online platform that serves as a global hub for music enthusiasts, providing access to live performances streamed from celebrated music venues and international festivals like Rock in Rio, Outside Lands Music and Arts Festival, and Hangout Music Festival. Additionally, the platform features exclusive artist content, original productions, and insightful industry interviews. The LiveXLive service boasts a comprehensive selection of musical genres, spanning rock, pop, alternative, electronic dance music (EDM), and country. It showcases content from both established superstars, such as Rihanna, Katy Perry, Major Lazer, and Maroon 5, as well as up-and-coming artists performing in clubs and venues worldwide. The company's operational portfolio also encompasses notable venues like KOKO, The Marquee, TAO, and the Saban Theatre.
Sun, 28 Jan 2024
LiveXLive Announces New Two-Year $7 Million Secured Revolving Credit Facility and Extends Maturity of its Existing Subordinat... - ADVFN
Wed, 06 Oct 2021
LiveXLive Media Completes Corporate Name Change To LiveOne - PR Newswire
Wed, 15 Sep 2021
LiveXLive rebrands as LiveOne, plans to spin out pay-per-view business as separate public company - Music Business Worldwide
Mon, 24 May 2021
iHeartMedia Announces Lineup For The Virtual 2021 “iHeartRadio KIIS FM Wango Tango” Hosted By Ryan Seacrest On June 30 - iHeartMedia, Inc.
Thu, 25 Mar 2021
LiveXLive Partners With Lomotif As Its Global Social Media Marketing Partner And Presenting Sponsor For Music Lives 2021 - PR Newswire
Sun, 28 Feb 2021
Are Virtual Concerts the Future of Live Entertainment? - Los Angeles Business Journal
| Price to Book Value: P/BV, a ratio used to compare book value to its current market price, to gauge whether a stock is valued properly. |
Outperform |
| Price to Earnings: PE, the ratio for valuing a company that measures its current share price relative to its earnings per share (EPS). |
Underperform |
| Discounted cash flow: DCF, a valuation method used to estimate the value of an investment based on its expected future cash flows. |
Outperform |
| Return on Assets: ROA, indicates how profitable a company is in relation to its total assets, how efficiently uses assets to generate a profit. |
Neutral |
| Return on Equity: ROE, a measure of financial performance calculated by dividing net income by equity. a gauge of profitability and efficiency. |
Underperform |
| Debt to Equity: evaluate financial leverage, reflects the ability of equity to cover outstanding debts in the event of a business downturn. |
Outperform |
|
Exchange:
NASDAQ
|
|
|
Sector:
Communication Services
|
|
|
Industry:
Entertainment
|
|
| Shares Out | 0 (M) |
| Shares Float | 0 (M) |
| Held by Insiders | (%) |
| Held by Institutions | (%) |
| Shares Short | 0 (K) |
| Shares Short P.Month | 0 (K) |
| EPS | |
| EPS Est Next Qtrly | |
| EPS Est This Year | |
| EPS Est Next Year | |
| Book Value (p.s.) | |
| Profit Margin | % |
| Operating Margin | % |
| Return on Assets (ttm) | % |
| Return on Equity (ttm) | % |
| Qtrly Rev. Growth | % |
| Gross Profit (p.s.) | |
| Sales Per Share | |
| EBITDA (p.s.) | |
| Qtrly Earnings Growth | % |
| Operating Cash Flow | 0 (M) |
| Levered Free Cash Flow | 0 (M) |
| PE Ratio | |
| PEG Ratio | |
| Price to Book value | |
| Price to Sales | |
| Price to Cash Flow |
| Dividend | |
| Forward Dividend | |
| Dividend Yield | 0% |
| Dividend Pay Date | |
| Ex-Dividend Date |

|

|
|

|
|
|
|
|
|