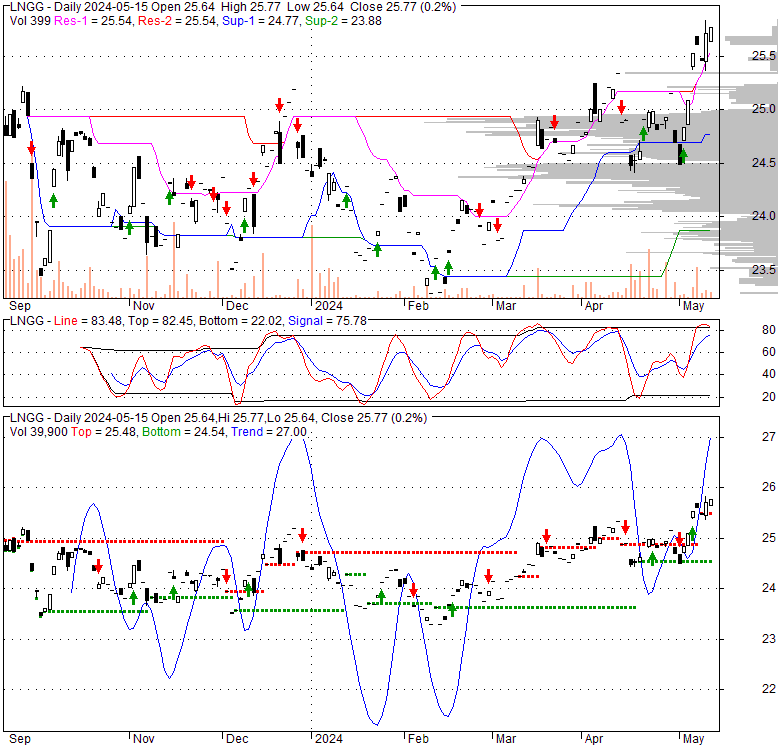
| 24.93 0.065 (0.26%) | 04-26 16:00 | |||||||||||||
|
|
| Short term | |
|||
| Mid term | |
|||
| Targets | 6-month : | 29.59 |
1-year : | 34.56 |
| Resists | First : | 25.34 |
Second : | 29.59 |
| Pivot price | 24.94 |
|||
| Supports | First : | 24.76 |
Second : | 24.4 |
| MAs | MA(5) : | 24.92 |
MA(20) : | 24.92 |
| MA(100) : | 24.32 |
MA(250) : | 0 | |
| MACD | MACD : | 0 |
Signal : | 0.1 |
| %K %D | K(14,3) : | 53.7 |
D(3) : | 55.7 |
| RSI | RSI(14): 54 |
|||
| 52-week | High : | 25.34 | Low : | 23.29 |
Price has closed above its short-term moving average. Short-term moving average is currently above mid-term; and above long-term moving average. From the relationship between price and moving averages: This stock is BULLISH in short-term; and BULLISH in mid-long term.[ LNGG ] has closed above bottom band by 48.8%. Bollinger Bands are 19.5% narrower than normal. The current width of the bands does not suggest anything about the future direction or movement of prices.
| If tomorrow: | Open lower | Open higher |
| High: | 24.88 - 25.01 | 25.01 - 25.09 |
| Low: | 24.51 - 24.68 | 24.68 - 24.79 |
| Close: | 24.58 - 24.83 | 24.83 - 25 |
LNGG provides exposure to stocks that are materially engaged in the liquefied natural gas industry. The index may comprise of both pure-play and non-pure-play companies from around the world that are involved in four main business segments: liquefaction, LNG carriers, regasification, and diversified LNG. The fund may invest in non-pure play companies that derive significant revenues, R&D investments and/or applicable businesses in the sector. Eligible securities meeting market-cap and liquidity requirements are weighted based on their revenue-adjusted float market capitalization. Securities deriving less than 20% of its revenue from the sum of one or more of the segments are capped at 2%. The index is reconstituted semi-annually on the third Friday of June and December, while quarterly rebalancing occurs on the third Friday of the last month of each calendar quarter.
Tue, 18 Sep 2018
LINN Energy and Roan Holdings Announce Definitive Agreement to Combine 100% of Their Interests in Roan LLC Into ... - GlobeNewswire
Tue, 07 Aug 2018
LINN Energy Completes Spin-Off of Riviera Resources - GlobeNewswire
Tue, 16 Jan 2018
LINN Energy to Sell Altamont Bluebell Field for $132 Million - EnerCom Inc.
Wed, 22 Nov 2017
Icahn becomes largest shareholder in oil-and-gas producer SandRidge - New York Business Journal - The Business Journals
Tue, 27 Jun 2017
LINN Energy and Citizen Energy Announce the Formation of Roan Resources, a Merge/SCOOP/STACK Pure Play ... - GlobeNewswire
Thu, 01 Jun 2017
Jonah Energy Closes Asset Buy from Linn Energy - EnerCom Inc.
| Price to Book Value: P/BV, a ratio used to compare book value to its current market price, to gauge whether a stock is valued properly. |
Neutral |
| Price to Earnings: PE, the ratio for valuing a company that measures its current share price relative to its earnings per share (EPS). |
Neutral |
| Discounted cash flow: DCF, a valuation method used to estimate the value of an investment based on its expected future cash flows. |
Neutral |
| Return on Assets: ROA, indicates how profitable a company is in relation to its total assets, how efficiently uses assets to generate a profit. |
Neutral |
| Return on Equity: ROE, a measure of financial performance calculated by dividing net income by equity. a gauge of profitability and efficiency. |
Neutral |
| Debt to Equity: evaluate financial leverage, reflects the ability of equity to cover outstanding debts in the event of a business downturn. |
Neutral |

|
Exchange:
AMEX
|
|
|
Sector:
Financial Services
|
|
|
Industry:
Asset Management
|
|
| Shares Out | 0 (M) |
| Shares Float | 0 (M) |
| Held by Insiders | 0 (%) |
| Held by Institutions | 0 (%) |
| Shares Short | 0 (K) |
| Shares Short P.Month | 0 (K) |
| EPS | 0 |
| EPS Est Next Qtrly | 0 |
| EPS Est This Year | 0 |
| EPS Est Next Year | 0 |
| Book Value (p.s.) | 0 |
| Profit Margin | 0 % |
| Operating Margin | 0 % |
| Return on Assets (ttm) | 0 % |
| Return on Equity (ttm) | 0 % |
| Qtrly Rev. Growth | 0 % |
| Gross Profit (p.s.) | 0 |
| Sales Per Share | 0 |
| EBITDA (p.s.) | 0 |
| Qtrly Earnings Growth | 0 % |
| Operating Cash Flow | 0 (M) |
| Levered Free Cash Flow | 0 (M) |
| PE Ratio | 0 |
| PEG Ratio | 0 |
| Price to Book value | 0 |
| Price to Sales | 0 |
| Price to Cash Flow | 0 |
| Dividend | 0 |
| Forward Dividend | 0 |
| Dividend Yield | 0% |
| Dividend Pay Date | Invalid DateTime. |
| Ex-Dividend Date | Invalid DateTime. |