
| 0.7135 0.184 (34.62%) | 09-21 15:59 | |||||||||||||
|
|
| Short term |   |
|||
| Mid term | |
|||
| Targets | 6-month : | 1.16 |
1-year : | 1.5 |
| Resists | First : | 0.99 |
Second : | 1.28 |
| Pivot price | 0.57 |
|||
| Supports | First : | 0.51 | Second : | 0.43 |
| MAs | MA(5) : | 0.56 |
MA(20) : | 0.59 |
| MA(100) : | 0.68 |
MA(250) : | 0.67 |
|
| MACD | MACD : | -0.1 |
Signal : | -0.1 |
| %K %D | K(14,3) : | 14.4 |
D(3) : | 8 |
| RSI | RSI(14): 64.2 |
|||
| 52-week | High : | 1.48 | Low : | 0.36 |
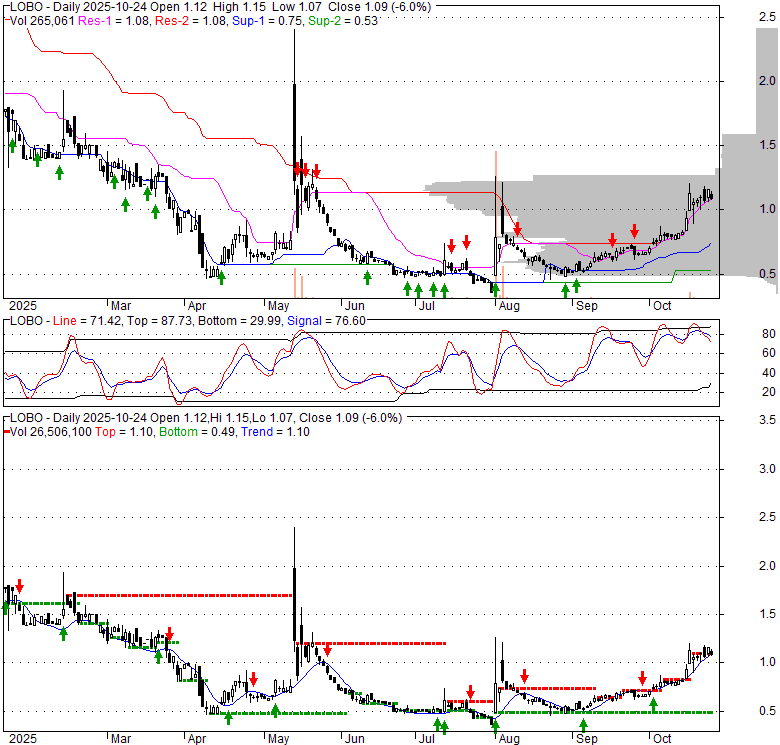
Price has closed above its short-term moving average. Short-term moving average is currently below mid-term; and below long-term moving average. From the relationship between price and moving averages: This stock is NEUTRAL in short-term; and BEARISH in mid-long term.[ LOBO ] has closed Bollinger Bands are 0.8% narrower than normal. The current width of the bands does not suggest anything about the future direction or movement of prices.
| If tomorrow: | Open lower | Open higher |
| High: | 1.29 - 1.3 | 1.3 - 1.31 |
| Low: | 0.67 - 0.68 | 0.68 - 0.68 |
| Close: | 0.71 - 0.71 | 0.71 - 0.72 |
Lobo Technologies Ltd. engages in the design, development, manufacture, and sales of e-bicycles, e-mopeds, e-tricycles, and electric off-highway four-wheeled shuttles in the People's Republic of China. It operates through two segments, Electric Vehicles and Accessories Sales, and Software Royalties and Development and Design Services. The company offers two-wheeled electric vehicles, such as e-bicycles and e-mopeds; three-wheeled electric vehicles comprising e-tricycles; and electric off-highway four-wheeled shuttles, including golf carts and e-scooters for the elderly and disabled persons, as well as AI robotic products. It also provides automobile information and entertainment software development and design services for automotive electronics, such as multimedia interactive systems, multifunctional rear-view mirrors, dash-cams, and household solar electronic system. The company was formerly known as Lobo EV Technologies Ltd. and changed its name to Lobo Technologies Ltd. in August 2025. Lobo EV Technologies Ltd. was incorporated in 2021 and is headquartered in Wuxi, China. Lobo Technologies Ltd. operates as a subsidiary of Wealthford Capital Ltd.
Mon, 21 Sep 2026
Lobo Technologies Stock Surges Monday: What's Happening? - Benzinga
Mon, 21 Sep 2026
Stock Market Today: S&P 500, Nasdaq 100 Futures Gain as Trump Issues Fresh Warning to Iran — MRVL, AAPL, ACN in Focus - TradingView
Mon, 21 Sep 2026
Why Lobo Technologies Shares Are Trading Higher By Around 32%; Here Are 20 Stocks Moving Premarket - Benzinga
Fri, 18 Sep 2026
Lobo Technologies Ltd. (LOBO) Stock Rises on Q2 2026 Earnings - Quiver Quantitative
Fri, 18 Sep 2026
Lobo Technologies 1H Rev $14.6M >LOBO - Moomoo
Fri, 18 Sep 2026
New AI segment boosts sales at LOBO Technologies (LOBO) even as cash burn rises - Stock Titan
| Price to Book Value: P/BV, a ratio used to compare book value to its current market price, to gauge whether a stock is valued properly. |
Outperform |
| Price to Earnings: PE, the ratio for valuing a company that measures its current share price relative to its earnings per share (EPS). |
Underperform |
| Discounted cash flow: DCF, a valuation method used to estimate the value of an investment based on its expected future cash flows. |
Underperform |
| Return on Assets: ROA, indicates how profitable a company is in relation to its total assets, how efficiently uses assets to generate a profit. |
Underperform |
| Return on Equity: ROE, a measure of financial performance calculated by dividing net income by equity. a gauge of profitability and efficiency. |
Underperform |
| Debt to Equity: evaluate financial leverage, reflects the ability of equity to cover outstanding debts in the event of a business downturn. |
Underperform |
|
Exchange:
NASDAQ
|
|
|
Sector:
Consumer Cyclical
|
|
|
Industry:
Auto - Manufacturers
|
|
| Shares Out | 10 (M) |
| Shares Float | 10 (M) |
| Held by Insiders | 1.4 (%) |
| Held by Institutions | 1.3 (%) |
| Shares Short | 47 (K) |
| Shares Short P.Month | 138 (K) |
| EPS | -0.52 |
| EPS Est Next Qtrly | 0 |
| EPS Est This Year | 0 |
| EPS Est Next Year | 0 |
| Book Value (p.s.) | 0.56 |
| Profit Margin | -23.6 % |
| Operating Margin | -26.1 % |
| Return on Assets (ttm) | -11.4 % |
| Return on Equity (ttm) | -67.2 % |
| Qtrly Rev. Growth | 22.8 % |
| Gross Profit (p.s.) | 0.3 |
| Sales Per Share | 2.29 |
| EBITDA (p.s.) | -0.39 |
| Qtrly Earnings Growth | 0 % |
| Operating Cash Flow | -2 (M) |
| Levered Free Cash Flow | -1 (M) |
| PE Ratio | -1.38 |
| PEG Ratio | 0 |
| Price to Book value | 1.27 |
| Price to Sales | 0.31 |
| Price to Cash Flow | -4.25 |
| Dividend | 0 |
| Forward Dividend | 0 |
| Dividend Yield | 0% |
| Dividend Pay Date | Invalid DateTime. |
| Ex-Dividend Date | Invalid DateTime. |

|

|
|

|
|
|
|
|
|