| 3.73 0.03 (0.81%) | 12-22 16:00 | |||||||||||||
|
|
| Short term | |
|||
| Mid term | ||||
| Targets | 6-month : | 4.41 | 1-year : | 4.5 |
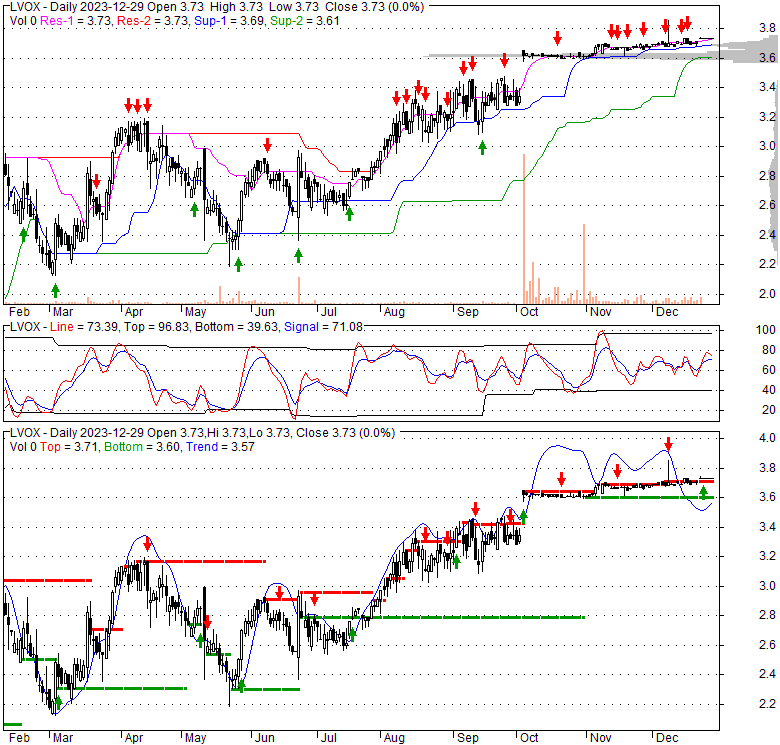
| Resists | First : | 3.77 | Second : | 3.85 |
| Pivot price | 3.7 |
|||
| Supports | First : | 3.65 | Second : | 3.03 |
| MAs | MA(5) : | 3.73 |
MA(20) : | 3.7 |
| MA(100) : | 3.5 |
MA(250) : | 3.04 |
|
| MACD | MACD : | 0 |
Signal : | 0 |
| %K %D | K(14,3) : | 30.3 |
D(3) : | 31.1 |
| RSI | RSI(14): 61.8 | |||
| 52-week | High : | 3.85 | Low : | 2.11 |
Price has closed below its short-term moving average. Short-term moving average is currently above mid-term; and above long-term moving average. From the relationship between price and moving averages: This stock is NEUTRAL in short-term; and BULLISH in mid-long term.[ LVOX ] has closed below upper band by 21.4%. Bollinger Bands are 69.6% narrower than normal. The narrow width of the bands suggests low volatility as compared to its normal range. The bands have been in this narrow range for 46 bars. This is a sign that the market may be about to initiate a new trend.
| If tomorrow: | Open lower | Open higher |
| High: | 3.73 - 3.75 | 3.75 - 3.77 |
| Low: | 3.69 - 3.71 | 3.71 - 3.73 |
| Close: | 3.7 - 3.73 | 3.73 - 3.76 |
LiveVox, Inc. develops and provides cloud contact center software for businesses. Its products include Four Clouds, an outbound voice solution that enables to manage regulatory requirements with the option of three manual and one automated outbound dialing system; bundles, including two-way messaging, outbound campaigns and compliance, speech analytics, inbound contact center, and cloud interactive voice response (IVR) solutions; inbound voice solutions, which comprise automatic call distributor, IVR, and wallboards; and blended omnichannel solutions, such as voice, email, SMS, virtual agents, and webchat. The company also offers CRM, which leverages unified customer profiles to create, facilitate, and manages digital engagement; Workforce Optimization, that helps contact centers to measure and manage agent workforce; and SpeechIQ, an AI-driven speech analytics solution to promote compliance, productivity, and quality in contact centers. It serves financial services, teleservices, healthcare, telecom, customer care, BPO, and collection industries. The company has a strategic partnership with Telarus. LiveVox, Inc. was formerly known as Tools For Health, Inc. and changed its name to LiveVox, Inc. in June 2006. The company was incorporated in 1998 and is based in San Francisco, California. LiveVox, Inc. has additional locations in Atlanta, Georgia; Bengaluru, India; Denver, Colorado; Medellin, Colombia; New York, New York; St. Louis, Missouri; and Columbus, Ohio.
Wed, 17 Apr 2024
LiveVox Holdings, Inc. (LVOX) Reports Q3 Loss, Tops Revenue Estimates - Yahoo Movies UK
Mon, 25 Mar 2024
Shareholders in LiveVox Holdings (NASDAQ:LVOX) are in the red if they invested three years ago - Yahoo News Canada
Tue, 26 Dec 2023
NICE Announces The Close of The LiveVox Acquisition, Creating a Conversational AI Powerhouse - Business Wire
Tue, 19 Dec 2023
SHAREHOLDER ALERT: Levi & Korsinsky, LLP Notifies Investors of an Investigation into the Fairness of the ... - PR Newswire
Wed, 04 Oct 2023
San Francisco AI call center LiveVox to be acquired by Nice Ltd. for $353 million - The Business Journals
Wed, 04 Oct 2023
NICE to Acquire LiveVox, Revolutionizing How Organizations Manage Proactive Outreach With the Power of ... - Business Wire
| Price to Book Value: P/BV, a ratio used to compare book value to its current market price, to gauge whether a stock is valued properly. |
Outperform |
| Price to Earnings: PE, the ratio for valuing a company that measures its current share price relative to its earnings per share (EPS). |
Underperform |
| Discounted cash flow: DCF, a valuation method used to estimate the value of an investment based on its expected future cash flows. |
Neutral |
| Return on Assets: ROA, indicates how profitable a company is in relation to its total assets, how efficiently uses assets to generate a profit. |
Underperform |
| Return on Equity: ROE, a measure of financial performance calculated by dividing net income by equity. a gauge of profitability and efficiency. |
Underperform |
| Debt to Equity: evaluate financial leverage, reflects the ability of equity to cover outstanding debts in the event of a business downturn. |
Outperform |
|
Exchange:
NASDAQ
|
|
|
Sector:
Technology
|
|
|
Industry:
Software - Infrastructure
|
|
| Shares Out | 95 (M) |
| Shares Float | 18 (M) |
| Held by Insiders | 7.8 (%) |
| Held by Institutions | 16.4 (%) |
| Shares Short | 1,050 (K) |
| Shares Short P.Month | 922 (K) |
| EPS | -0.28 |
| EPS Est Next Qtrly | 0 |
| EPS Est This Year | 0 |
| EPS Est Next Year | 0 |
| Book Value (p.s.) | 0.93 |
| Profit Margin | -17.2 % |
| Operating Margin | -7.2 % |
| Return on Assets (ttm) | -4.6 % |
| Return on Equity (ttm) | -26.1 % |
| Qtrly Rev. Growth | 0.3 % |
| Gross Profit (p.s.) | 0.9 |
| Sales Per Share | 1.51 |
| EBITDA (p.s.) | -0.09 |
| Qtrly Earnings Growth | 0 % |
| Operating Cash Flow | -10 (M) |
| Levered Free Cash Flow | 6 (M) |
| PE Ratio | -13.82 |
| PEG Ratio | -0.2 |
| Price to Book value | 4.01 |
| Price to Sales | 2.46 |
| Price to Cash Flow | -34.21 |
| Dividend | 0 |
| Forward Dividend | 0 |
| Dividend Yield | 0% |
| Dividend Pay Date | Invalid DateTime. |
| Ex-Dividend Date | Invalid DateTime. |

|

|
|

|
|
|
|
|
|