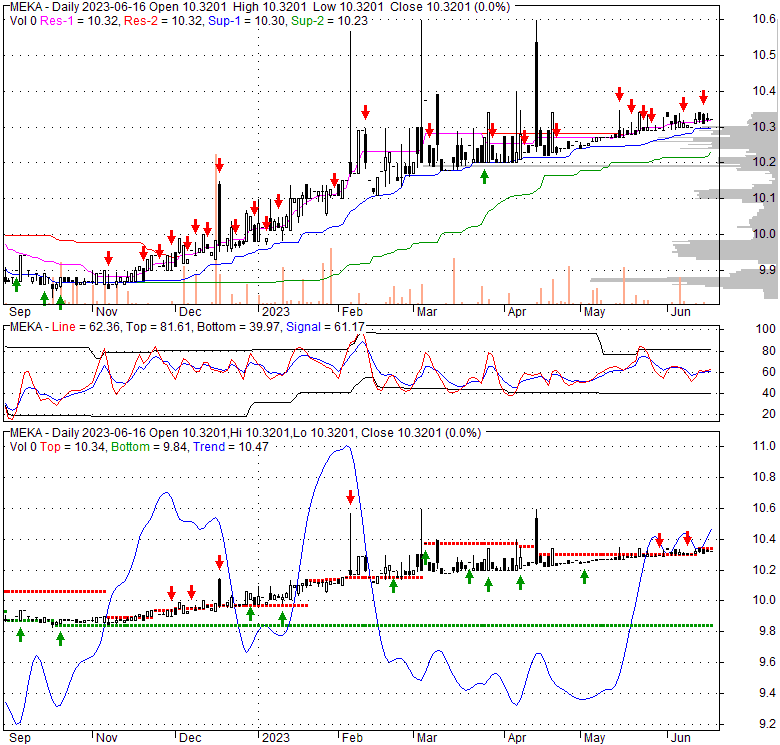
| 10.3201 0 (0%) | 06-15 15:53 | |||||||||||||
|
|
| Short term | ||||
| Mid term | ||||
| Targets | 6-month : | 12.08 | 1-year : | 14.11 |
| Resists | First : | 10.35 | Second : | 12.08 |
| Pivot price | 10.3 |
|||
| Supports | First : | 10.3 | Second : | 10.27 |
| MAs | MA(5) : | 10.31 |
MA(20) : | 10.3 |
| MA(100) : | 10.23 |
MA(250) : | 10.06 |
|
| MACD | MACD : | 0 |
Signal : | 0 |
| %K %D | K(14,3) : | 53.4 |
D(3) : | 54.1 |
| RSI | RSI(14): 57.9 | |||
| 52-week | High : | 10.6 | Low : | 9.81 |
Price has closed above its short-term moving average. Short-term moving average is currently above mid-term; and above long-term moving average. From the relationship between price and moving averages: This stock is BULLISH in short-term; and BULLISH in mid-long term.[ MEKA ] has closed below upper band by 27.2%. Bollinger Bands are 66.3% narrower than normal. The narrow width of the bands suggests low volatility as compared to its normal range. The bands have been in this narrow range for 25 bars. This is a sign that the market may be about to initiate a new trend.
| If tomorrow: | Open lower | Open higher |
| High: | 10.33 - 10.38 | 10.38 - 10.43 |
| Low: | 10.17 - 10.23 | 10.23 - 10.3 |
| Close: | 10.2 - 10.3 | 10.3 - 10.4 |
MELI Kaszek Pioneer Corp does not have significant operations. It intends to effect a merger, capital stock exchange, asset acquisition, stock purchase, reorganization, or similar business combination. The company was incorporated in 2021 and is based in Miami, Florida.
Mon, 10 Jan 2022
Still Waiting for a 2022 SPAC Deal as Capstar Sets Redemption Record - TheStreet
Fri, 29 Oct 2021
October SPAC Issuance nears $10B and SPACs are Hot Again - TheStreet
Fri, 22 Oct 2021
Trump SPAC DWAC Rises over 100% Again to Cap Wild Week - TheStreet
Thu, 21 Oct 2021
Digital World Acquisition (DWAC) Soars on Trump's SPAC Deal - TheStreet
Thu, 14 Oct 2021
Spring Valley (SV) and AeroFarms end SPAC Merger - TheStreet
| Price to Book Value: P/BV, a ratio used to compare book value to its current market price, to gauge whether a stock is valued properly. |
Outperform |
| Price to Earnings: PE, the ratio for valuing a company that measures its current share price relative to its earnings per share (EPS). |
Outperform |
| Discounted cash flow: DCF, a valuation method used to estimate the value of an investment based on its expected future cash flows. |
Neutral |
| Return on Assets: ROA, indicates how profitable a company is in relation to its total assets, how efficiently uses assets to generate a profit. |
Outperform |
| Return on Equity: ROE, a measure of financial performance calculated by dividing net income by equity. a gauge of profitability and efficiency. |
Underperform |
| Debt to Equity: evaluate financial leverage, reflects the ability of equity to cover outstanding debts in the event of a business downturn. |
Underperform |
|
Exchange:
NASDAQ
|
|
|
Sector:
Financial Services
|
|
|
Industry:
Shell Companies
|
|
| Shares Out | 30 (M) |
| Shares Float | 26 (M) |
| Held by Insiders | 10 (%) |
| Held by Institutions | 72 (%) |
| Shares Short | 0 (K) |
| Shares Short P.Month | 0 (K) |
| EPS | 1.73 |
| EPS Est Next Qtrly | 0 |
| EPS Est This Year | 0 |
| EPS Est Next Year | 0 |
| Book Value (p.s.) | -0.11 |
| Profit Margin | 0 % |
| Operating Margin | 0 % |
| Return on Assets (ttm) | 0 % |
| Return on Equity (ttm) | 0 % |
| Qtrly Rev. Growth | 0 % |
| Gross Profit (p.s.) | 0 |
| Sales Per Share | 0 |
| EBITDA (p.s.) | 0 |
| Qtrly Earnings Growth | -97.5 % |
| Operating Cash Flow | 2 (M) |
| Levered Free Cash Flow | 0 (M) |
| PE Ratio | 5.96 |
| PEG Ratio | 0 |
| Price to Book value | -103.21 |
| Price to Sales | 0 |
| Price to Cash Flow | 125.74 |
| Dividend | 0 |
| Forward Dividend | 0 |
| Dividend Yield | 0% |
| Dividend Pay Date | Invalid DateTime. |
| Ex-Dividend Date | Invalid DateTime. |

|

|
|

|
|
|
|
|
|