| 30.1752 0.27 (0.9%) | 05-03 14:22 | |||||||||||||
|
|
| Short term | |
|||
| Mid term | ||||
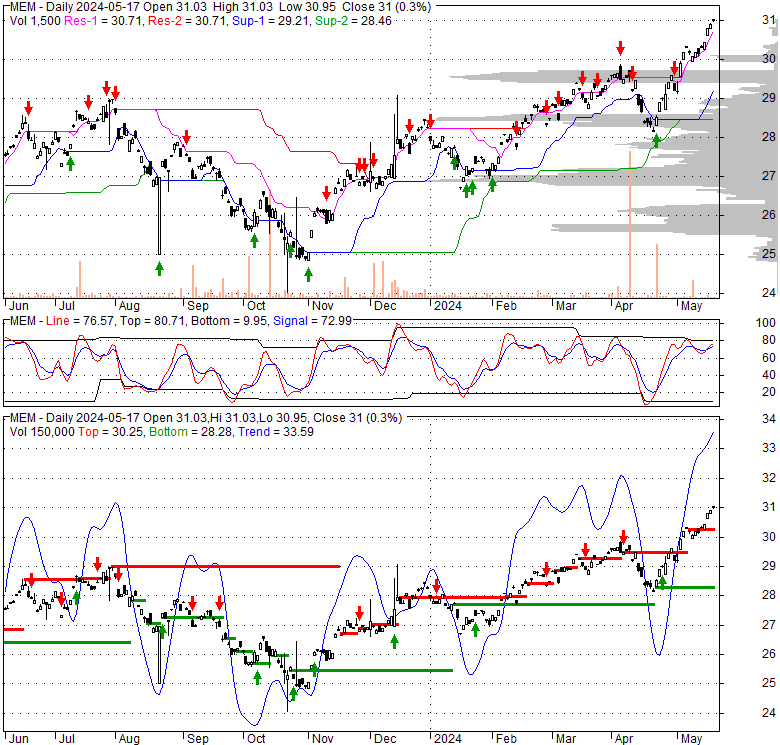
| Targets | 6-month : | 35.29 |
1-year : | 41.22 |
| Resists | First : | 30.21 |
Second : | 35.29 |
| Pivot price | 29 |
|||
| Supports | First : | 28.94 |
Second : | 28.14 |
| MAs | MA(5) : | 29.62 |
MA(20) : | 29.08 |
| MA(100) : | 28.4 |
MA(250) : | 27.6 |
|
| MACD | MACD : | 0.1 |
Signal : | 0 |
| %K %D | K(14,3) : | 88.1 |
D(3) : | 81.5 |
| RSI | RSI(14): 67.3 |
|||
| 52-week | High : | 30.21 | Low : | 24.01 |
Price has closed above its short-term moving average. Short-term moving average is currently above mid-term; and above long-term moving average. From the relationship between price and moving averages: This stock is BULLISH in short-term; and BULLISH in mid-long term.[ MEM ] has closed It is unclear right now based on current values. 79.2% wider than normal. The large width of the bands suggest high volatility as compared to its normal range. The bands have been in this wide range for 1 days. This is a sign that the current trend might continue.
| If tomorrow: | Open lower | Open higher |
| High: | 30.25 - 30.36 | 30.36 - 30.5 |
| Low: | 29.69 - 29.82 | 29.82 - 29.96 |
| Close: | 29.98 - 30.19 | 30.19 - 30.42 |
Under normal circumstances, the fund seeks to achieve its investment objective by investing at least 80% of its net assets, which include borrowings for investment purposes, in the common and preferred stocks of companies located in emerging market countries. It seeks to invest in companies capable of sustainable growth based on the fundamental characteristics of those companies, including balance sheet information; number of employees; size and stability of cash flow; management’s depth, adaptability and integrity; product lines; marketing strategies; corporate governance; and financial health.
Wed, 10 Apr 2024
AI Is a Tailwind for Emerging Markets ETFs - etf.com
Fri, 02 Feb 2024
Matthews Asia: China Could Be 2024's Best Performing Market - etf.com
Thu, 11 Jan 2024
Matthews Launches New Discovery Active ETFs Focused on Smaller Companies With Innovative and Entrepreneurial ... - GlobeNewswire
Fri, 09 Jun 2023
VettaFi Voices On: Investing in Emerging Markets - ETF Trends
Fri, 26 May 2023
NYSE's ETF Leaders - Matthews Asia's David Dali - ETFdb.com
Tue, 28 Feb 2023
Small ETFs Gaining Traction in 2023 - Yahoo Finance
| Price to Book Value: P/BV, a ratio used to compare book value to its current market price, to gauge whether a stock is valued properly. |
Neutral |
| Price to Earnings: PE, the ratio for valuing a company that measures its current share price relative to its earnings per share (EPS). |
Neutral |
| Discounted cash flow: DCF, a valuation method used to estimate the value of an investment based on its expected future cash flows. |
Neutral |
| Return on Assets: ROA, indicates how profitable a company is in relation to its total assets, how efficiently uses assets to generate a profit. |
Neutral |
| Return on Equity: ROE, a measure of financial performance calculated by dividing net income by equity. a gauge of profitability and efficiency. |
Neutral |
| Debt to Equity: evaluate financial leverage, reflects the ability of equity to cover outstanding debts in the event of a business downturn. |
Neutral |
|
Exchange:
AMEX
|
|
|
Sector:
Financial Services
|
|
|
Industry:
Asset Management
|
|
| Shares Out | 0 (M) |
| Shares Float | 0 (M) |
| Held by Insiders | 0 (%) |
| Held by Institutions | 0 (%) |
| Shares Short | 0 (K) |
| Shares Short P.Month | 0 (K) |
| EPS | 0 |
| EPS Est Next Qtrly | 0 |
| EPS Est This Year | 0 |
| EPS Est Next Year | 0 |
| Book Value (p.s.) | 0 |
| Profit Margin | 0 % |
| Operating Margin | 0 % |
| Return on Assets (ttm) | 0 % |
| Return on Equity (ttm) | 0 % |
| Qtrly Rev. Growth | 0 % |
| Gross Profit (p.s.) | 0 |
| Sales Per Share | 0 |
| EBITDA (p.s.) | 0 |
| Qtrly Earnings Growth | 0 % |
| Operating Cash Flow | 0 (M) |
| Levered Free Cash Flow | 0 (M) |
| PE Ratio | 0 |
| PEG Ratio | 0 |
| Price to Book value | 0 |
| Price to Sales | 0 |
| Price to Cash Flow | 0 |
| Dividend | 0 |
| Forward Dividend | 0 |
| Dividend Yield | 0% |
| Dividend Pay Date | Invalid DateTime. |
| Ex-Dividend Date | Invalid DateTime. |

|

|
|

|
|
|
|
|
|