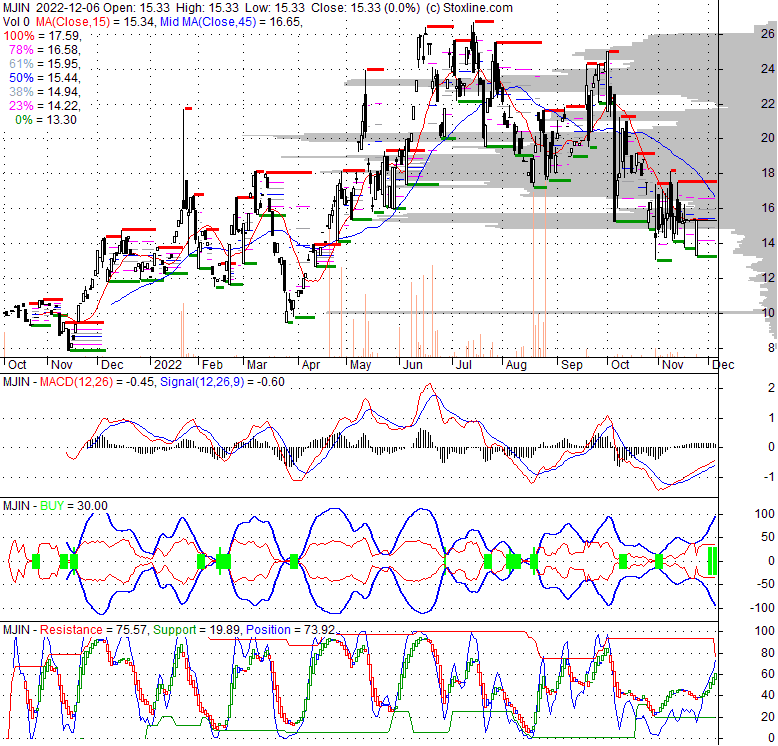
| 15.3349 0 (0%) | 11-23 15:09 | |||||||||||||
|
|
| Short term | |
|||
| Mid term | ||||
| Targets | 6-month : | 19.07 |
1-year : | 21.25 |
| Resists | First : | 16.32 |
Second : | 18.2 |
| Pivot price | 15.33 |
|||
| Supports | First : | 13.3 |
Second : | 11.06 |
| MAs | MA(5) : | 15.33 | MA(20) : | 15.36 |
| MA(100) : | 19 |
MA(250) : | 17.56 |
|
| MACD | MACD : | -0.5 |
Signal : | -0.7 |
| %K %D | K(14,3) : | 60.5 |
D(3) : | 53.9 |
| RSI | RSI(14): 41.6 | |||
| 52-week | High : | 26.72 | Low : | 9.52 |
Price has closed below its short-term moving average. Short-term moving average is currently below mid-term; and below long-term moving average. From the relationship between price and moving averages: This stock is NEUTRAL in short-term; and BEARISH in mid-long term.[ MJIN ] has closed above bottom band by 48.9%. Bollinger Bands are 98.1% narrower than normal. The narrow width of the bands suggests low volatility as compared to its normal range. The bands have been in this narrow range for 15 bars. This is a sign that the market may be about to initiate a new trend.
| If tomorrow: | Open lower | Open higher |
| High: | 15.37 - 15.45 | 15.45 - 15.51 |
| Low: | 15.12 - 15.23 | 15.23 - 15.31 |
| Close: | 15.19 - 15.35 | 15.35 - 15.47 |
The fund invests in financial instruments that, in combination, provide daily inverse exposure to the index or to ETFs that track the index to seek returns equal to -200% of the daily return of the index. The index tracks the performance of the common stock of companies across the globe. The fund will only directly invest in companies that are engaged exclusively in legal activities under applicable national and local laws, including U.S. federal and state laws. It is non-diversified.
Thu, 08 Feb 2024
Understanding Cannabis ETFs’ Wacky Divergence - ETF Trends
Wed, 15 Dec 2021
10 Cannabis ETFs Ranked For 2022 - ETF Focus on TheStreet: ETF research and Trade Ideas - TheStreet
Thu, 07 Oct 2021
Lottery Ticket ETFs Flourish | etf.com - etf.com
Wed, 06 Oct 2021
ETFMG Launches 2X Inverse Cannabis ETF | etf.com - etf.com
Wed, 06 Oct 2021
New Inverse Leveraged Cannabis ETF Launches: MJIN By ETFMG - Yahoo Finance
| Price to Book Value: P/BV, a ratio used to compare book value to its current market price, to gauge whether a stock is valued properly. |
Neutral |
| Price to Earnings: PE, the ratio for valuing a company that measures its current share price relative to its earnings per share (EPS). |
Neutral |
| Discounted cash flow: DCF, a valuation method used to estimate the value of an investment based on its expected future cash flows. |
Neutral |
| Return on Assets: ROA, indicates how profitable a company is in relation to its total assets, how efficiently uses assets to generate a profit. |
Neutral |
| Return on Equity: ROE, a measure of financial performance calculated by dividing net income by equity. a gauge of profitability and efficiency. |
Neutral |
| Debt to Equity: evaluate financial leverage, reflects the ability of equity to cover outstanding debts in the event of a business downturn. |
Neutral |
|
Exchange:
AMEX
|
|
|
Sector:
|
|
|
Industry:
|
|
| Shares Out | 0 (M) |
| Shares Float | 0 (M) |
| Held by Insiders | 0 (%) |
| Held by Institutions | 0 (%) |
| Shares Short | 0 (K) |
| Shares Short P.Month | 0 (K) |
| EPS | 0 |
| EPS Est Next Qtrly | 0 |
| EPS Est This Year | 0 |
| EPS Est Next Year | 0 |
| Book Value (p.s.) | 0 |
| Profit Margin | 0 % |
| Operating Margin | 0 % |
| Return on Assets (ttm) | 0 % |
| Return on Equity (ttm) | 0 % |
| Qtrly Rev. Growth | 0 % |
| Gross Profit (p.s.) | 0 |
| Sales Per Share | 0 |
| EBITDA (p.s.) | 0 |
| Qtrly Earnings Growth | 0 % |
| Operating Cash Flow | 0 (M) |
| Levered Free Cash Flow | 0 (M) |
| PE Ratio | 0 |
| PEG Ratio | 0 |
| Price to Book value | 0 |
| Price to Sales | 0 |
| Price to Cash Flow | 0 |
| Dividend | 0 |
| Forward Dividend | 0 |
| Dividend Yield | 0% |
| Dividend Pay Date | Invalid DateTime. |
| Ex-Dividend Date | Invalid DateTime. |

|

|
|

|
|
|
|
|
|